Log In/Sign Up
Your email has been sent.
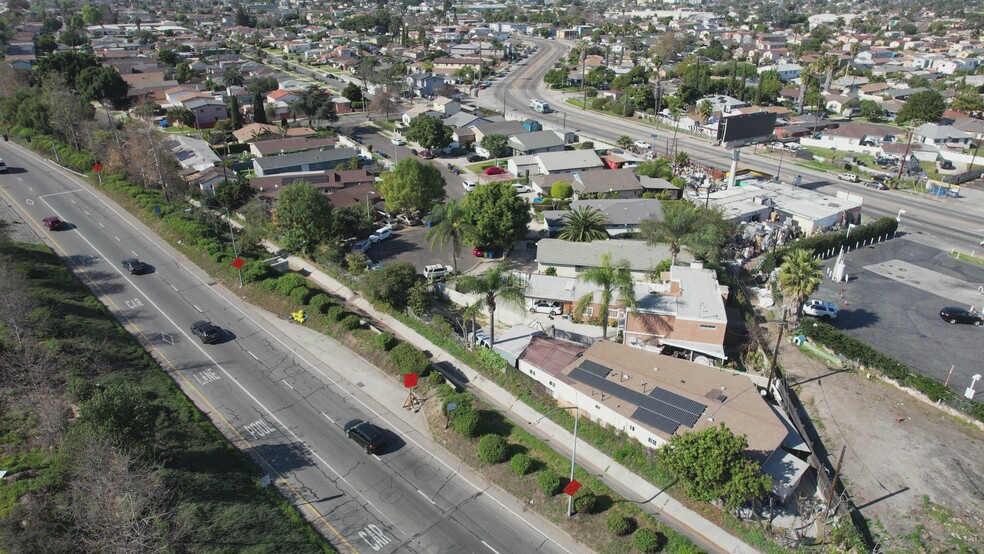
E. Imperial Hwy @ South Central Ave 1132 E Imperial Hwy 4,146 SF 100% Leased Retail Building Los Angeles, CA 90059 $3,128,713 CAD ($754.63 CAD/SF) 5% Cap Rate

Investment Highlights
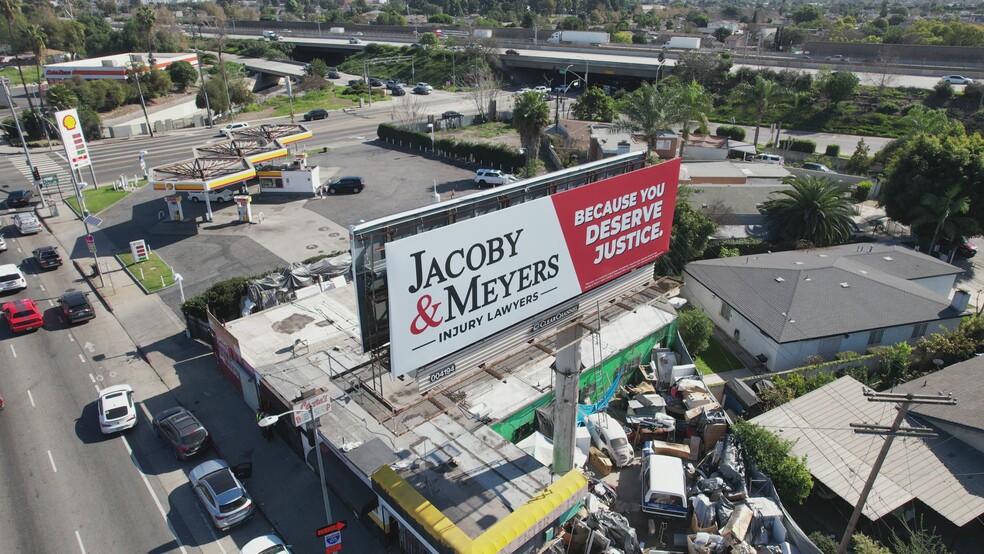
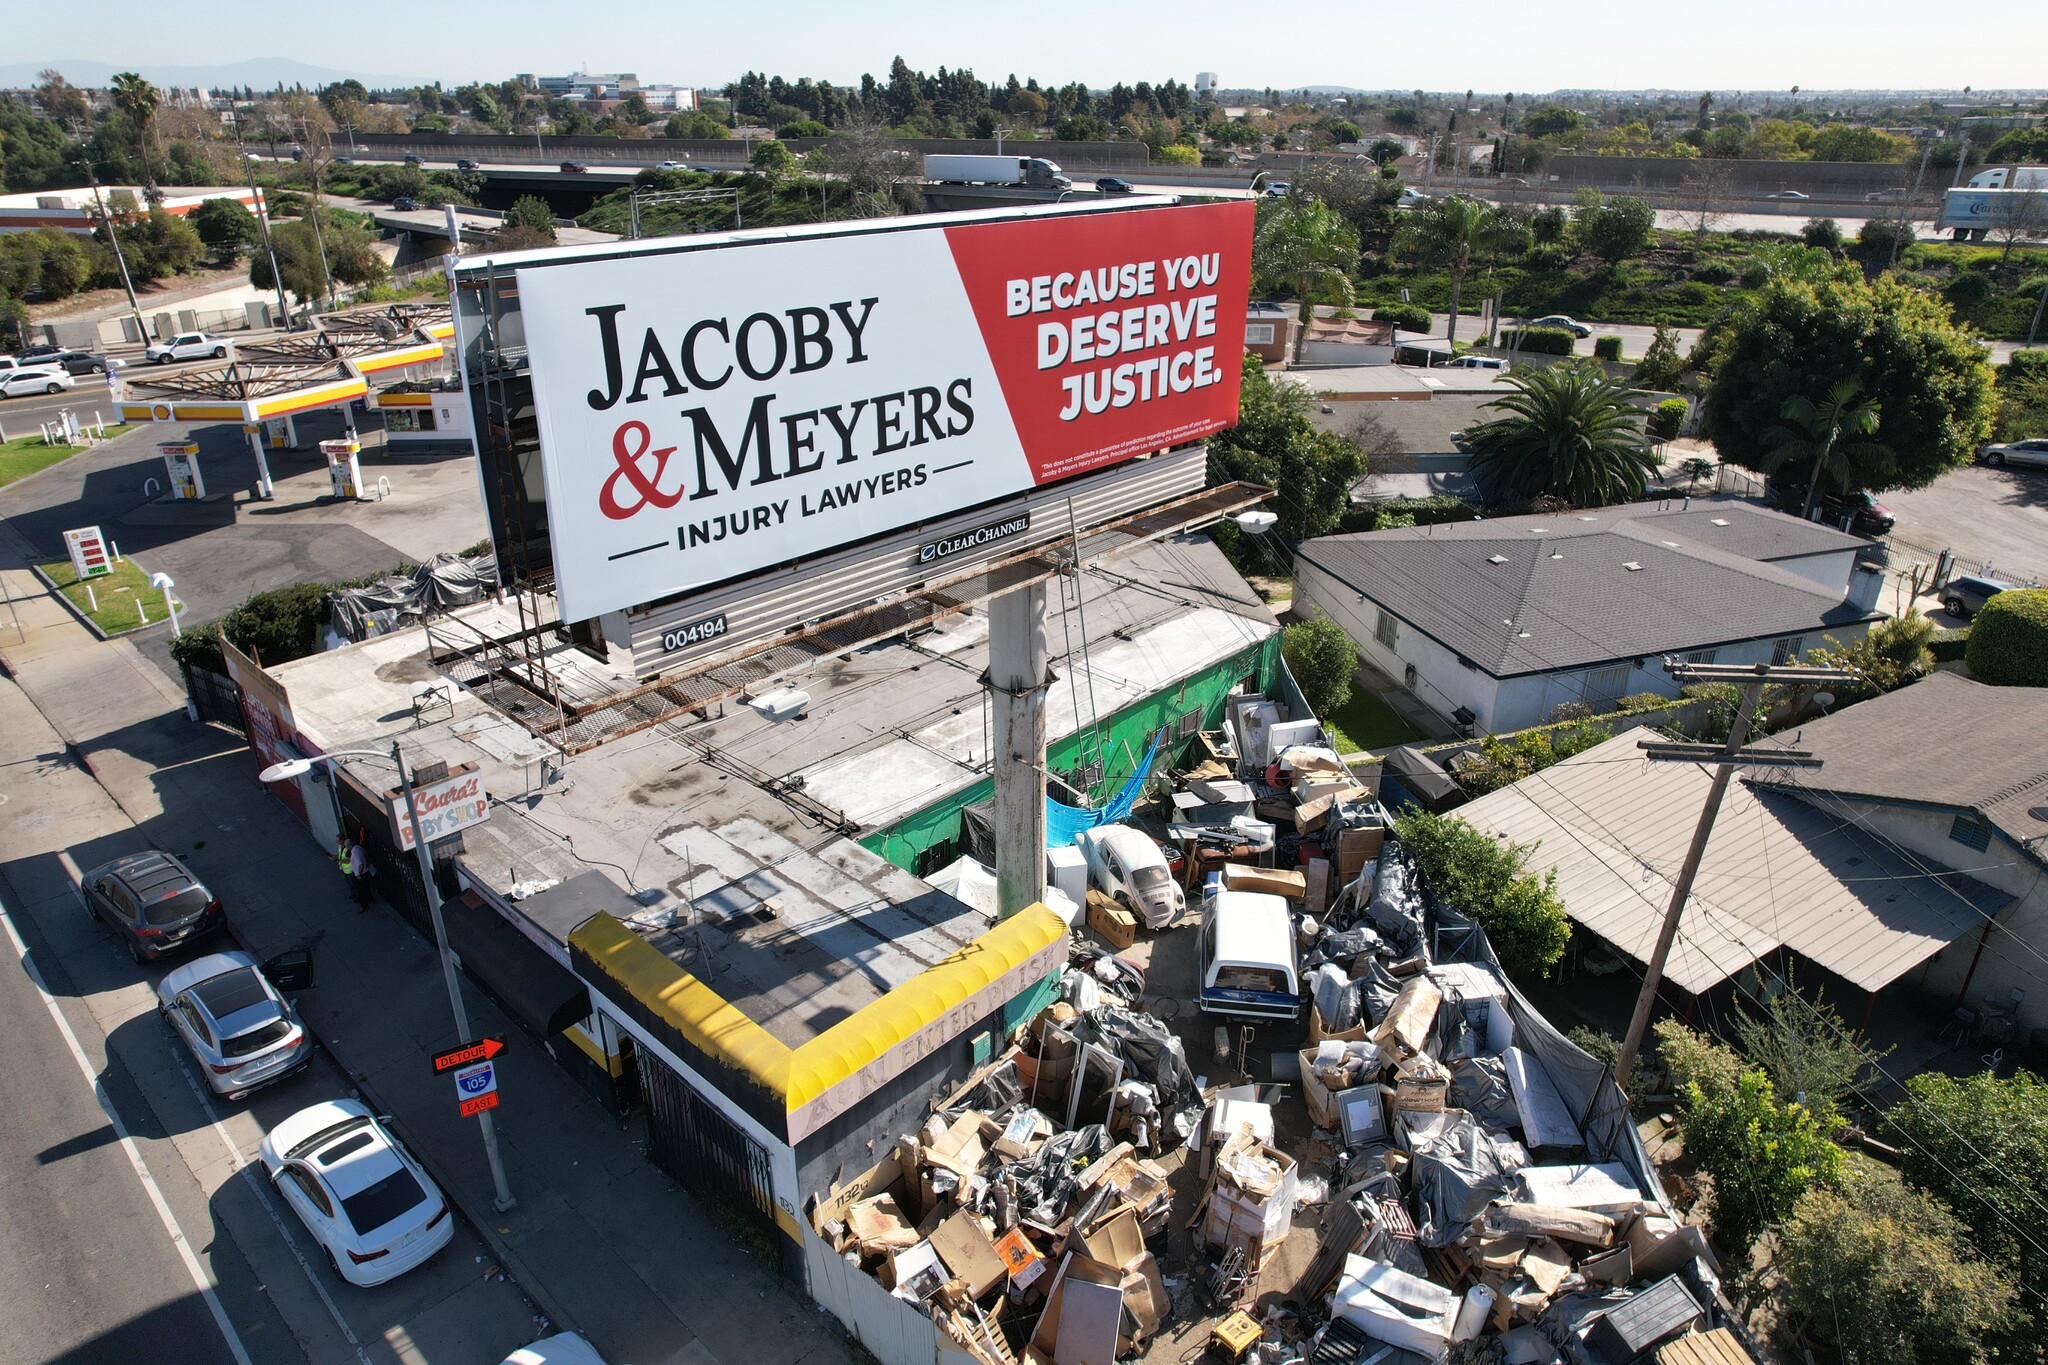
- Billboard Income. Month to Month multi tenant Income.
- Opportunity Zone.
- Heavy Traffic at East Imperial Hwy and South Central Ave. Great owner/user or development opportunity.
Executive Summary
East Imperial Hwy @ South Central Ave.
Exceptional Infill Value-Add or Redevelopment Property with large Billboard Income with Freeway 105 Exposure.
Effective 02-01-26, the gross monthly income of the property is $10,380. The buyer will have the option to terminate any tenant unit with 30 days' notice, except for the billboard, whose lease matures on 08-01-26. This is an ideal opportunity for a buyer who can take advantage of the monthly income while they decide on a redevelopment, partial or complete owner/user occupancy with the billboard income.
Financial Summary (Actual - 2025) Click Here to Access |
Annual (CAD) | Annual Per SF (CAD) |
|---|---|---|
| Gross Rental Income |
-

|
-
|
| Other Income |
-
|
-
|
| Vacancy Loss |
-
|
-
|
| Effective Gross Income |
-
|
-
|
| Net Operating Income |
$99,999
|
$9.99
|
Financial Summary (Actual - 2025) Click Here to Access
| Gross Rental Income (CAD) | |
|---|---|
| Annual | - |
| Annual Per SF | - |
| Other Income (CAD) | |
|---|---|
| Annual | - |
| Annual Per SF | - |
| Vacancy Loss (CAD) | |
|---|---|
| Annual | - |
| Annual Per SF | - |
| Effective Gross Income (CAD) | |
|---|---|
| Annual | - |
| Annual Per SF | - |
| Net Operating Income (CAD) | |
|---|---|
| Annual | $99,999 |
| Annual Per SF | $9.99 |
Property Facts
Sale Type
Investment or Owner User
Sale Condition
Redevelopment Project
Property Type
Retail
Property Subtype
Building Size
4,146 SF
Building Class
C
Year Built
1959
Price
$3,128,713 CAD
Price Per SF
$754.63 CAD
Cap Rate
5%
NOI
$156,436 CAD
Percent Leased
100%
Tenancy
Multiple
Building Height
1 Story
Slab To Slab
10’
Building FAR
0.21
Lot Size
0.45 AC
Opportunity Zone
Yes
Zoning
C2 - LAC2
Opportunity Zone
Parking
30 Spaces (7.24 Spaces per 1,000 SF Leased)
Frontage
Amenities
- Fenced Lot
- Freeway Visibility
- Pylon Sign
- Signalized Intersection
Major Tenants Click Here to Access
- Tenant
- Industry
- SF Occupied
- Rent/SF
- Lease Type
- Lease End
- Clear Channel Outdoor - Billboard
- Information
-
99,999 SF
-
$9.99
-
Lorem Ipsum
-
Jan 0000
| Tenant | Industry | SF Occupied | Rent/SF | Lease Type | Lease End | |
| Clear Channel Outdoor - Billboard | Information | 99,999 SF | $9.99 | Lorem Ipsum | Jan 0000 |
Nearby Major Retailers


Property Taxes
| Parcel Numbers | Improvements Assessment | $617,069 CAD | |
| Land Assessment | $316,322 CAD | Total Assessment | $933,391 CAD |
Property Taxes
Parcel Numbers
Land Assessment
$316,322 CAD
Improvements Assessment
$617,069 CAD
Total Assessment
$933,391 CAD

1 of 11
Videos
Matterport 3D Exterior
Matterport 3D Tour
Photos
Street View
Street
Map
Presented by
Opics Properties
E. Imperial Hwy @ South Central Ave | 1132 E Imperial Hwy
Already a member? Log In
Hmm, there seems to have been an error sending your message. Please try again.
Thanks! Your message was sent.