Log In/Sign Up
Your email has been sent.
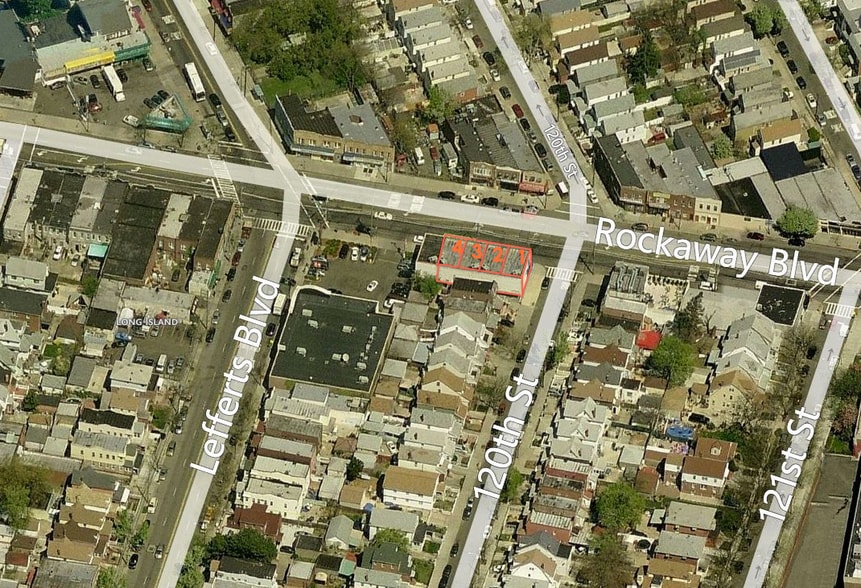
11914 Rockaway Blvd 3,407 SF 100% Leased Retail Building South Ozone Park, NY 11420 $3,153,108 CAD ($925.48 CAD/SF) 7% Cap Rate

Investment Highlights
- This property is a recently built, well-configured retail asset featuring high ceilings, substantial square footage, and flexible zoning. Strategicall
Executive Summary
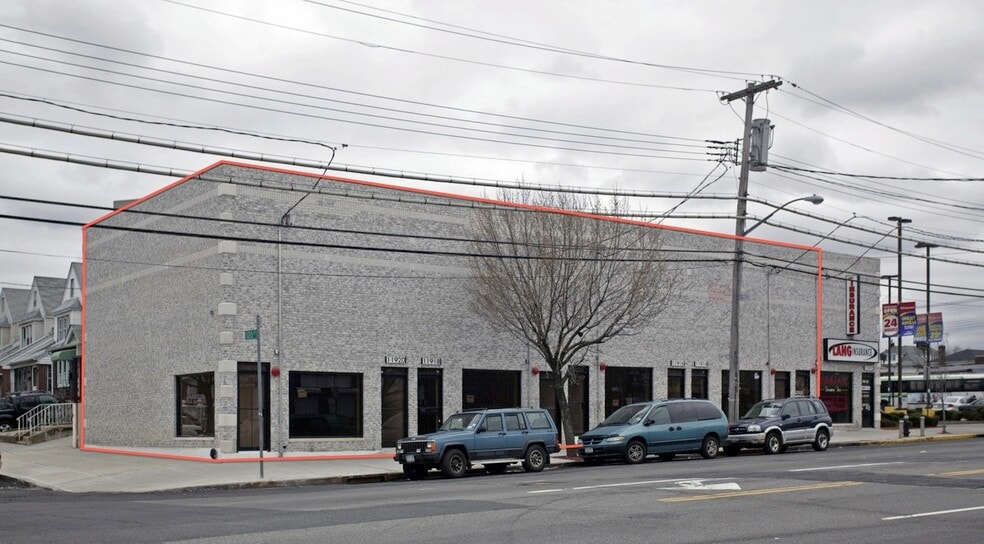
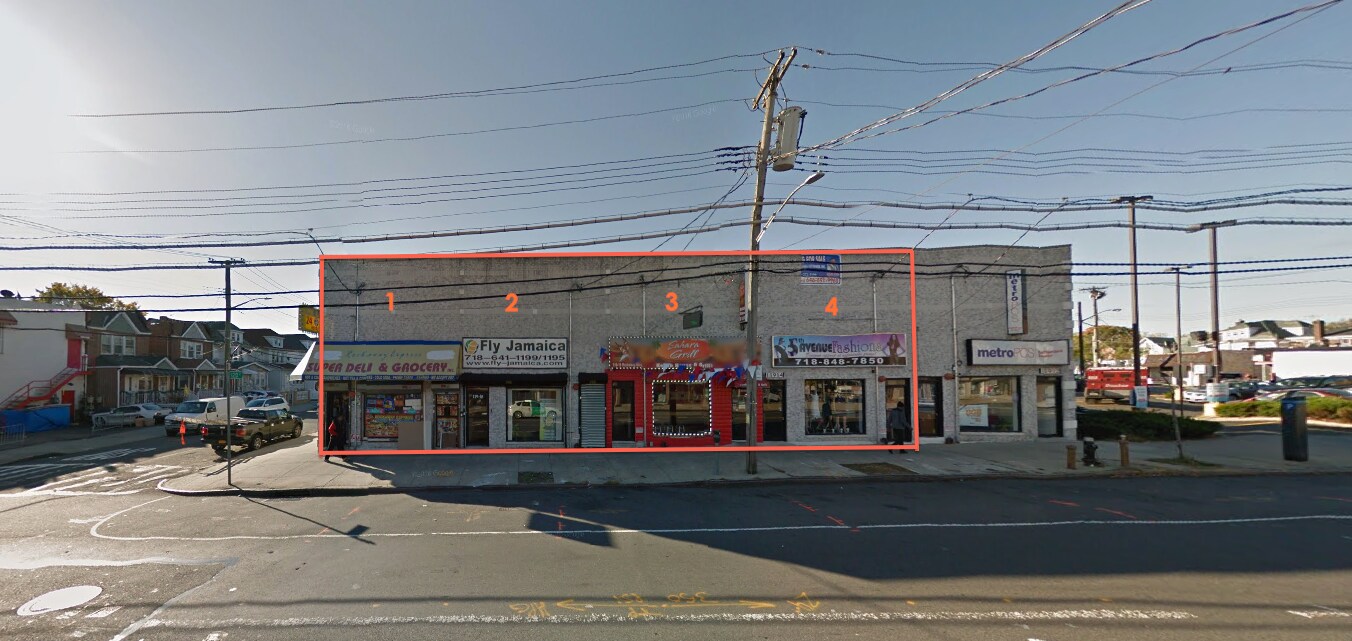
11914-11920 Rockaway Boulevard includes 4 retail store front buildings measuring 20x43 with 20 foot high ceilings. The high ceilings offer the potential for a second floor and more income. The buildings was completed in 2007. The current leases are all Gross leases , which helps keep the expenses very low. This is a high cash flow investment with a lot of upside.
The surrounding 1-mile radius is home to over 64,000 residents, with a median household income nearing $87,000 .
Strong pedestrian traffic: Walk Score of 89, Transit Score of 63, ideal for community-serving retail .
Immediate area businesses include mobile retail , fashion boutiques , delis, and health services—a well-established retail ecosystem
Financial Summary (Actual - 2024) |
Annual (CAD) | Annual Per SF (CAD) |
|---|---|---|
| Gross Rental Income |
$212,941

|
$62.50
|
| Other Income |
-
|
-
|
| Vacancy Loss |
-
|
-
|
| Effective Gross Income |
$212,941
|
$62.50
|
| Taxes |
$25,168
|
$7.39
|
| Operating Expenses |
$4,242
|
$1.25
|
| Total Expenses |
$29,410
|
$8.63
|
| Net Operating Income |
$183,531
|
$53.87
|
Financial Summary (Actual - 2024)
| Gross Rental Income (CAD) | |
|---|---|
| Annual | $212,941 |
| Annual Per SF | $62.50 |
| Other Income (CAD) | |
|---|---|
| Annual | - |
| Annual Per SF | - |
| Vacancy Loss (CAD) | |
|---|---|
| Annual | - |
| Annual Per SF | - |
| Effective Gross Income (CAD) | |
|---|---|
| Annual | $212,941 |
| Annual Per SF | $62.50 |
| Taxes (CAD) | |
|---|---|
| Annual | $25,168 |
| Annual Per SF | $7.39 |
| Operating Expenses (CAD) | |
|---|---|
| Annual | $4,242 |
| Annual Per SF | $1.25 |
| Total Expenses (CAD) | |
|---|---|
| Annual | $29,410 |
| Annual Per SF | $8.63 |
| Net Operating Income (CAD) | |
|---|---|
| Annual | $183,531 |
| Annual Per SF | $53.87 |
Property Facts
Sale Type
Investment or Owner User
Property Type
Retail
Property Subtype
Storefront
Building Size
3,407 SF
Building Class
C
Year Built
2005
Price
$3,153,108 CAD
Price Per SF
$925.48 CAD
Cap Rate
7%
NOI
$220,718 CAD
Percent Leased
100%
Tenancy
Multiple
Building Height
1 Story
Building FAR
0.98
Lot Size
0.08 AC
Zoning
R3-2, C2-3 - Situated in a dual-zone area—R3-2 (residential low-density) overlay and C2-3 (neighborhood commercial), enabling street-level retail and professional
Frontage
20’ on Rockaway Blvd
Exceptionally walkable
100/100
Moderately drivable
60/100
Exceptional public transit
100/100
Moderately bikeable
60/100
Nearby Major Retailers


Property Taxes
| Parcel Number | 11712-0042 | Total Assessment | $264,969 CAD (2026) |
| Land Assessment | $26,455 CAD (2026) | Annual Taxes | $25,168 CAD ($7.39 CAD/SF) |
| Improvements Assessment | $238,514 CAD (2026) | Tax Year | 2024 |
Property Taxes
Parcel Number
11712-0042
Land Assessment
$26,455 CAD (2026)
Improvements Assessment
$238,514 CAD (2026)
Total Assessment
$264,969 CAD (2026)
Annual Taxes
$25,168 CAD ($7.39 CAD/SF)
Tax Year
2024


1 of 4
Videos
Matterport 3D Exterior
Matterport 3D Tour
Photos
Street View
Street
Map
Presented by

11914 Rockaway Blvd
Already a member? Log In
Hmm, there seems to have been an error sending your message. Please try again.
Thanks! Your message was sent.