Log In/Sign Up
Your email has been sent.
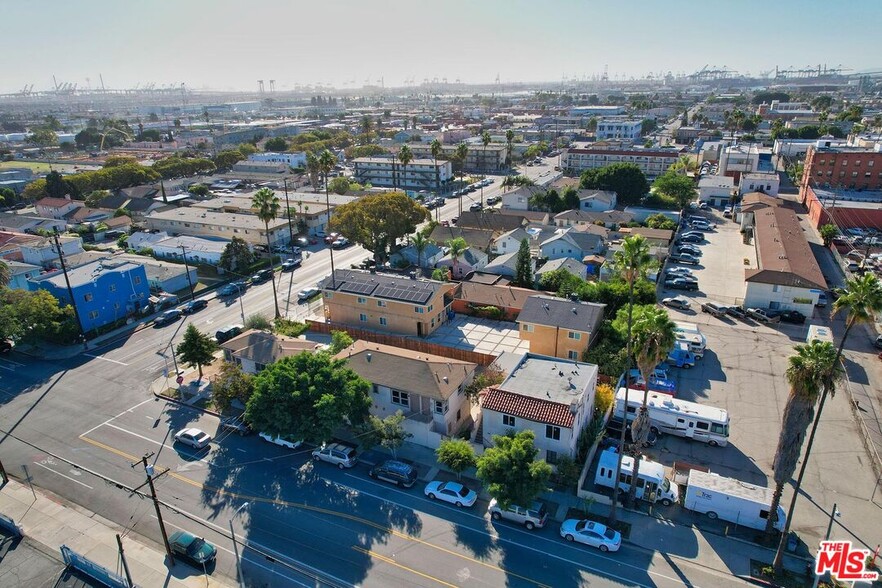
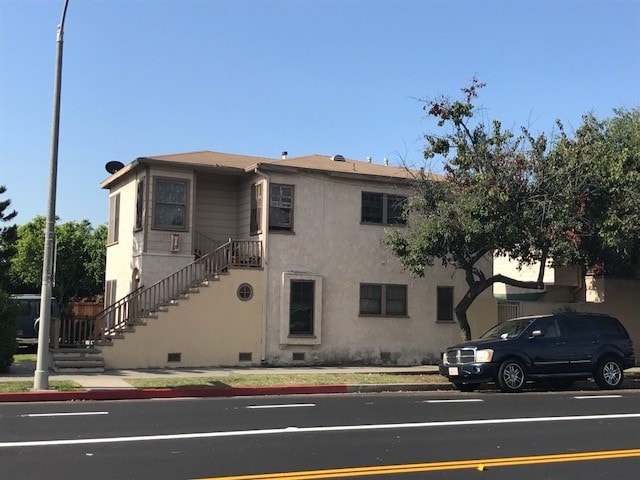
130 E Opp St 7 Unit Apartment Building $2,631,052 CAD ($375,865 CAD/Unit) 6.02% Cap Rate Wilmington, CA 90744

INVESTMENT HIGHLIGHTS
- Supreme opportunity for both investors and developers
- Approved plans to build two additional units have been obtained and will be delivered COE
- Potential to be turned into a giant 9-unit residential complex
EXECUTIVE SUMMARY
Proudly presenting this supreme opportunity for both investors and developers alike. 130 E Opp St is a prime rental income property with great current revenue as well as great potential and upside. Recent renovations are reflected in the improved rental income, especially from the four beautifully remodeled units; a brand-new ADU unit will be delivered at COE, along with substantial electric upgrades. In addition, approved plans to build two additional units have been obtained and will also be delivered COE, saving a lot of time and effort for the buyer. This gold mine is further bolstered by rental upside and potential to be turned into a 9-unit residential complex. 130 E Opp St truly is a best-of-both-worlds: a stable property with great current income that also oozes undeniable developmental value. High rental demand in the area is just the cherry-on-top.
FINANCIAL SUMMARY (ACTUAL - 2024) Click Here to Access |
ANNUAL (CAD) | ANNUAL PER SF (CAD) |
|---|---|---|
| Gross Rental Income |
$99,999

|
$9.99
|
| Other Income |
-
|
-
|
| Vacancy Loss |
-
|
-
|
| Effective Gross Income |
$99,999
|
$9.99
|
| Taxes |
-
|
-
|
| Operating Expenses |
-
|
-
|
| Total Expenses |
$99,999
|
$9.99
|
| Net Operating Income |
$99,999
|
$9.99
|
FINANCIAL SUMMARY (ACTUAL - 2024) Click Here to Access
| Gross Rental Income (CAD) | |
|---|---|
| Annual | $99,999 |
| Annual Per SF | $9.99 |
| Other Income (CAD) | |
|---|---|
| Annual | - |
| Annual Per SF | - |
| Vacancy Loss (CAD) | |
|---|---|
| Annual | - |
| Annual Per SF | - |
| Effective Gross Income (CAD) | |
|---|---|
| Annual | $99,999 |
| Annual Per SF | $9.99 |
| Taxes (CAD) | |
|---|---|
| Annual | - |
| Annual Per SF | - |
| Operating Expenses (CAD) | |
|---|---|
| Annual | - |
| Annual Per SF | - |
| Total Expenses (CAD) | |
|---|---|
| Annual | $99,999 |
| Annual Per SF | $9.99 |
| Net Operating Income (CAD) | |
|---|---|
| Annual | $99,999 |
| Annual Per SF | $9.99 |
PROPERTY FACTS
| Price | $2,631,052 CAD | Building Class | C |
| Price Per Unit | $375,865 CAD | Lot Size | 0.25 AC |
| Sale Type | Investment | Building Size | 4,509 SF |
| Cap Rate | 6.02% | Average Occupancy | 100% |
| Gross Rent Multiplier | 12.35 | No. Stories | 2 |
| No. Units | 7 | Year Built | 1930 |
| Property Type | Multifamily | Parking Ratio | 1.77/1,000 SF |
| Property Subtype | Apartment | Opportunity Zone |
Yes
|
| Apartment Style | Low-Rise | ||
| Zoning | R3 | ||
| Price | $2,631,052 CAD |
| Price Per Unit | $375,865 CAD |
| Sale Type | Investment |
| Cap Rate | 6.02% |
| Gross Rent Multiplier | 12.35 |
| No. Units | 7 |
| Property Type | Multifamily |
| Property Subtype | Apartment |
| Apartment Style | Low-Rise |
| Building Class | C |
| Lot Size | 0.25 AC |
| Building Size | 4,509 SF |
| Average Occupancy | 100% |
| No. Stories | 2 |
| Year Built | 1930 |
| Parking Ratio | 1.77/1,000 SF |
| Opportunity Zone |
Yes |
| Zoning | R3 |
UNIT MIX INFORMATION
| DESCRIPTION | NO. UNITS | AVG. RENT/MO | SF |
|---|---|---|---|
| 1+1 | 4 | $2,001 CAD | - |
| 2+1 | 3 | $2,739 CAD | - |


Walk Score®
Very Walkable (89)
Bike Score®
Very Bikeable (85)

1 of 26
VIDEOS
MATTERPORT 3D EXTERIOR
MATTERPORT 3D TOUR
PHOTOS
STREET VIEW
STREET
MAP

Presented by
Mi Jeong Kim
130 E Opp St
Already a member? Log In
Hmm, there seems to have been an error sending your message. Please try again.
Thanks! Your message was sent.