Log In/Sign Up
Your email has been sent.

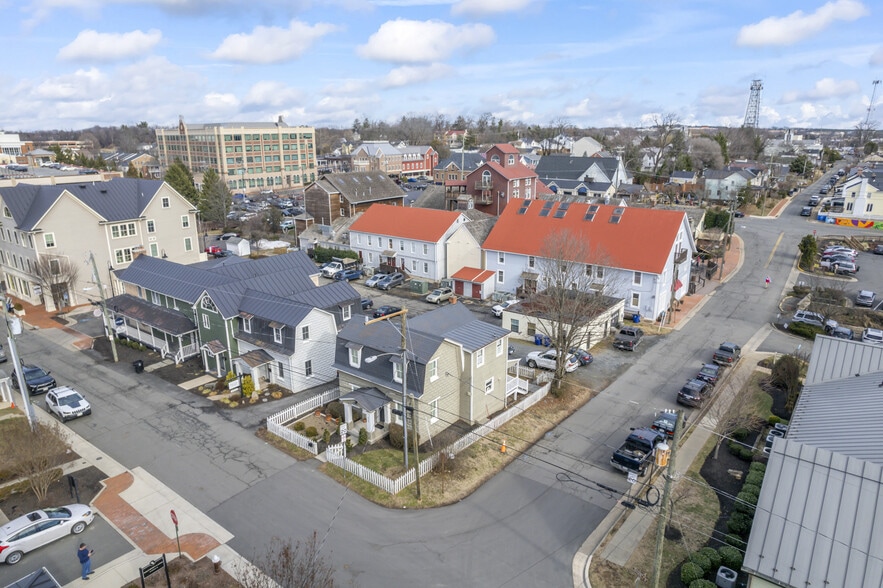
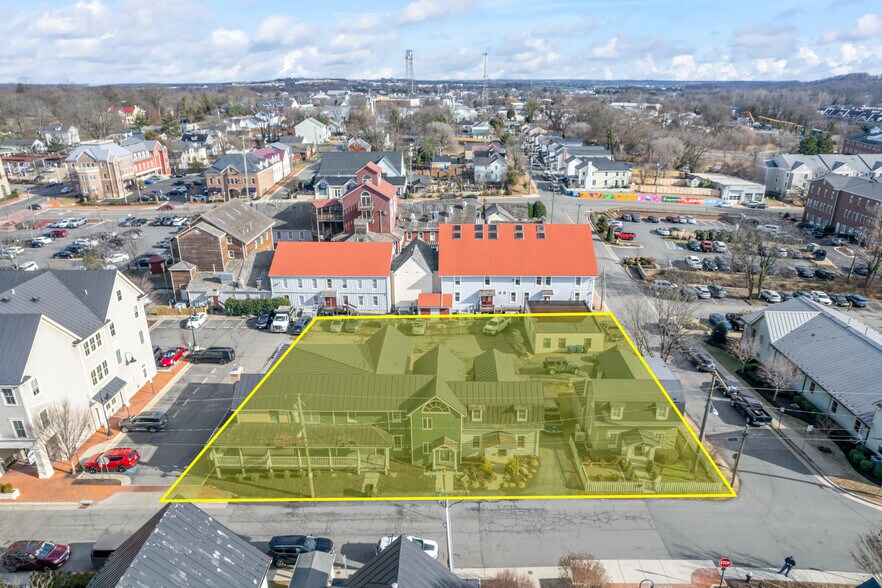
Multi-Tenant Retail Investment 208-212 Church SE st 24 Unit Apartment Building For Sale Leesburg, VA 20175

Investment Highlights
- Fully leased, stabilized income — 11,466 SF across three buildings, 100% occupied by 10 diversified tenants generating $286,765 in gross income.
- Three of the most below-market suites totaling 5,554 SF have leases expiring within the next 12 to 24 months, providing a low-risk path to NOI growth.
- Five-mile average household income of $219,101, Loudoun County median HHI of $170,463, and a downtown Leesburg residential base.
- Multiple in-place leases below current downtown market rates, with an estimated $55K–$90K of annual rent growth achievable through routine re-leasing.
- One block off King Street and steps from Tuscarora Mill, South Street Under, the Loudoun County Courthouse, and the W&OD Trail.
Executive Summary
Stabilized multi-tenant retail investment in the heart of downtown Leesburg with significant mark-to-market upside. The 11,466 SF property sits on a 0.55-acre corner at Church and South Streets, fully leased to 10 tenants generating $286,765 in gross income and $218,043 in NOI. Multiple in-place leases are materially below current downtown market rates, with an estimated $55,000–$90,000 of annual rent growth achievable through routine re-leasing as leases roll over the next 12 to 24 months. Diverse tenancy includes retail, office, residential, and creative-use users.
Financial Summary (Actual - 2025) |
Annual (CAD) | Annual Per SF (CAD) |
|---|---|---|
| Gross Rental Income |
$392,229

|
$9.81
|
| Other Income |
-
|
-
|
| Vacancy Loss |
-
|
-
|
| Effective Gross Income |
$392,229
|
$9.81
|
| Taxes |
$32,962
|
$0.82
|
| Operating Expenses |
$16,262
|
$0.41
|
| Total Expenses |
$49,225
|
$1.23
|
| Net Operating Income |
$343,005
|
$8.58
|
Financial Summary (Actual - 2025)
| Gross Rental Income (CAD) | |
|---|---|
| Annual | $392,229 |
| Annual Per SF | $9.81 |
| Other Income (CAD) | |
|---|---|
| Annual | - |
| Annual Per SF | - |
| Vacancy Loss (CAD) | |
|---|---|
| Annual | - |
| Annual Per SF | - |
| Effective Gross Income (CAD) | |
|---|---|
| Annual | $392,229 |
| Annual Per SF | $9.81 |
| Taxes (CAD) | |
|---|---|
| Annual | $32,962 |
| Annual Per SF | $0.82 |
| Operating Expenses (CAD) | |
|---|---|
| Annual | $16,262 |
| Annual Per SF | $0.41 |
| Total Expenses (CAD) | |
|---|---|
| Annual | $49,225 |
| Annual Per SF | $1.23 |
| Net Operating Income (CAD) | |
|---|---|
| Annual | $343,005 |
| Annual Per SF | $8.58 |
Property Facts
1 1
Moderately walkable
60/100
Exceptionally drivable
90/100
Limited public transit
30/100
Moderately bikeable
60/100
Property Taxes
| Parcel Numbers | Total Assessment | $3,782,715 CAD | |
| Land Assessment | $1,282,345 CAD | Annual Taxes | $32,962 CAD ($0.55 CAD/SF) |
| Improvements Assessment | $2,500,370 CAD | Tax Year | 2025 |
Property Taxes
Parcel Numbers
Land Assessment
$1,282,345 CAD
Improvements Assessment
$2,500,370 CAD
Total Assessment
$3,782,715 CAD
Annual Taxes
$32,962 CAD ($0.55 CAD/SF)
Tax Year
2025


1 of 19
Videos
Matterport 3D Exterior
Matterport 3D Tour
Photos
Street View
Street
Map

1 of 1
Presented by
Multi-Tenant Retail Investment | 208-212 Church SE st
Already a member? Log In
Hmm, there seems to have been an error sending your message. Please try again.
Thanks! Your message was sent.