Log In/Sign Up
Your email has been sent.

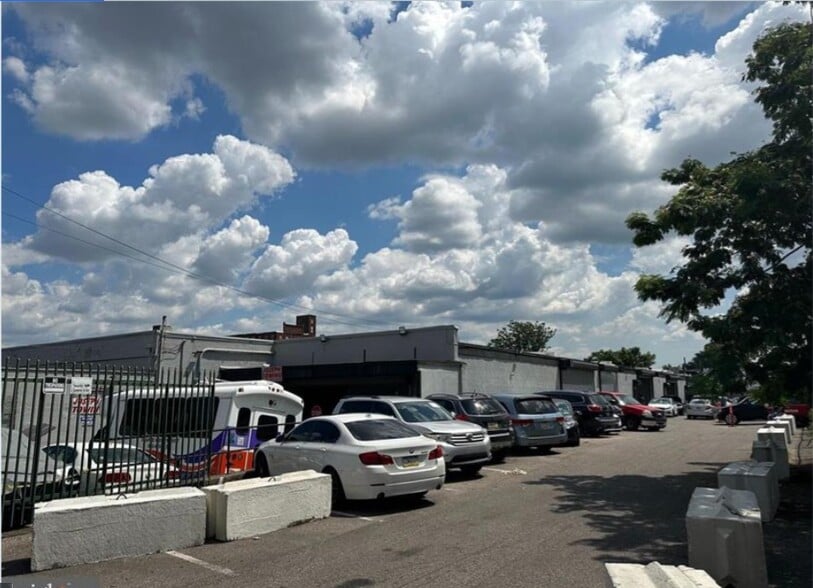
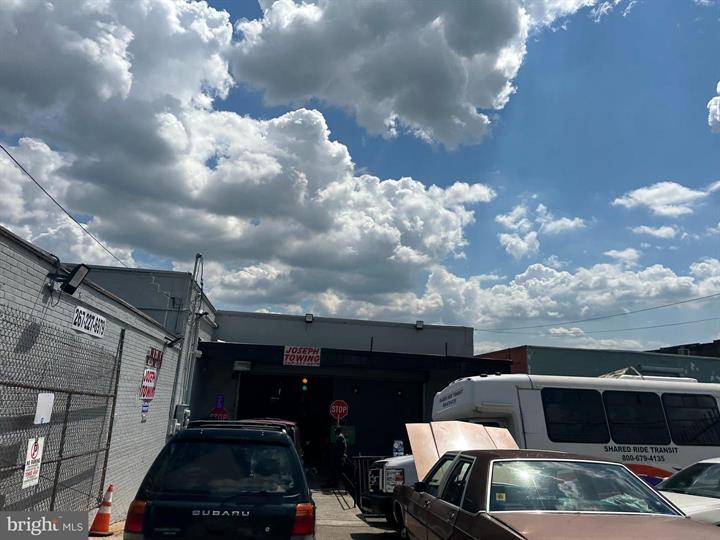
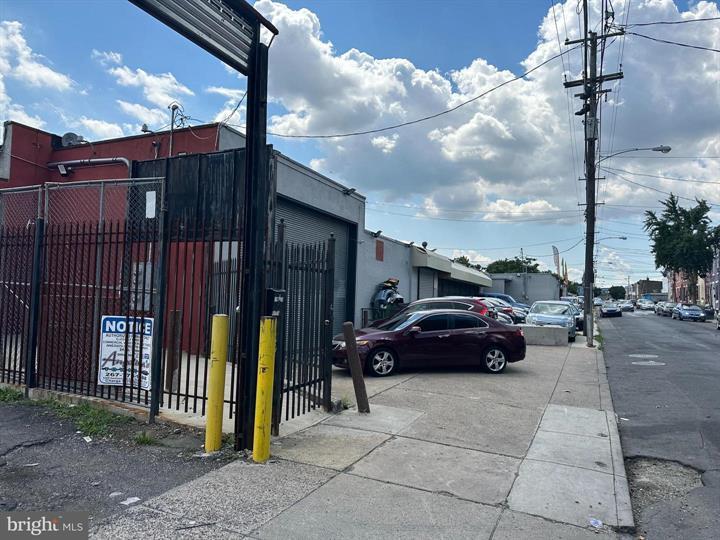
2929-69 B St 70,000 SF 100% Leased Industrial Building Philadelphia, PA 19134 $6,630,193 CAD ($94.72 CAD/SF) 7.57% Cap Rate
Investment Highlights
- lot is ideal for development while you still have income from garages all leases are attached
Executive Summary
The subject property consists of a class C industrial building that was built circa 1930 and contains approximately 70,000 SF. The building is current divided into 13 units/suites with 11 5,000 SF units and two (2) 7,500 SF units. A majority of the building features 16’ clear ceiling with other areas featuring higher ceilings. The building is accessed via 15 grade-level doors and in overall average condition. As of listing the building is 100% occupied by a total of 12 tenants with automotive repair and service business. The property is located on a 2.9186 acre site within the Kensington section of Philadelphia on the SEC of B Street and E Indiana Avenue. The property is located within the ICMX – Industrial Commercial Mixed-Use Zone of the City. This property includes 334 E Indiana Ave ID 884037701, 2961-69 B St ID 885974680, Expense: Taxes $39,800 Water 1300 $ Insurance $38,392 per owner
Financial Summary (Actual - 2024) |
Annual (CAD) | Annual Per SF (CAD) |
|---|---|---|
| Gross Rental Income |
$593,847

|
$8.48
|
| Other Income |
-
|
-
|
| Vacancy Loss |
-
|
-
|
| Effective Gross Income |
$593,847
|
$8.48
|
| Taxes |
$53,612
|
$0.77
|
| Operating Expenses |
$38,277
|
$0.55
|
| Total Expenses |
$91,889
|
$1.31
|
| Net Operating Income |
$501,958
|
$7.17
|
Financial Summary (Actual - 2024)
| Gross Rental Income (CAD) | |
|---|---|
| Annual | $593,847 |
| Annual Per SF | $8.48 |
| Other Income (CAD) | |
|---|---|
| Annual | - |
| Annual Per SF | - |
| Vacancy Loss (CAD) | |
|---|---|
| Annual | - |
| Annual Per SF | - |
| Effective Gross Income (CAD) | |
|---|---|
| Annual | $593,847 |
| Annual Per SF | $8.48 |
| Taxes (CAD) | |
|---|---|
| Annual | $53,612 |
| Annual Per SF | $0.77 |
| Operating Expenses (CAD) | |
|---|---|
| Annual | $38,277 |
| Annual Per SF | $0.55 |
| Total Expenses (CAD) | |
|---|---|
| Annual | $91,889 |
| Annual Per SF | $1.31 |
| Net Operating Income (CAD) | |
|---|---|
| Annual | $501,958 |
| Annual Per SF | $7.17 |
Property Facts
Amenities
- Fenced Lot
Utilities
- Water - City
- Sewer - City
Major Tenants
- Tenant
- Industry
- SF Occupied
- Rent/SF
- Lease Type
- Lease End
- Joseph Lopez
- Services
- 800 SF
- -
- Plus Utilities
- Dec 2030
| Tenant | Industry | SF Occupied | Rent/SF | Lease Type | Lease End | |
| Joseph Lopez | Services | 800 SF | - | Plus Utilities | Dec 2030 |

Walk Score®
Very Walkable (79)
Property Taxes
| Parcel Number | 884037700 | Total Assessment | $2,824,703 CAD (2026) |
| Land Assessment | $847,411 CAD (2026) | Annual Taxes | $53,612 CAD ($0.77 CAD/SF) |
| Improvements Assessment | $1,977,292 CAD (2026) | Tax Year | 2024 Payable 2025 |
Property Taxes
Parcel Number
884037700
Land Assessment
$847,411 CAD (2026)
Improvements Assessment
$1,977,292 CAD (2026)
Total Assessment
$2,824,703 CAD (2026)
Annual Taxes
$53,612 CAD ($0.77 CAD/SF)
Tax Year
2024 Payable 2025

1 of 17
Videos
Matterport 3D Exterior
Matterport 3D Tour
Photos
Street View
Street
Map

Presented by
2929-69 B St
Already a member? Log In
Hmm, there seems to have been an error sending your message. Please try again.
Thanks! Your message was sent.