Log In/Sign Up
Your email has been sent.

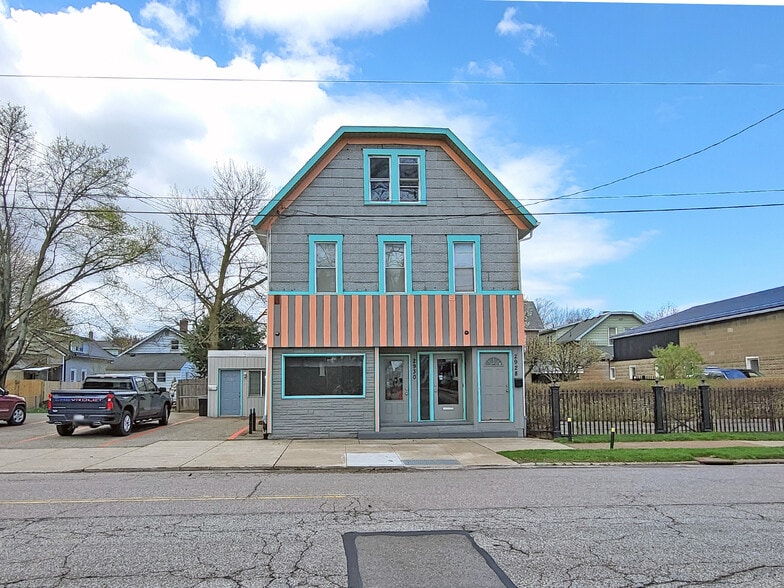
6-Unit, Mixed-Use Investment Property 2930 Cherry St 6 Unit Apartment Building $918,306 CAD ($153,051 CAD/Unit) 8.99% Cap Rate Erie, PA 16508

Investment Highlights
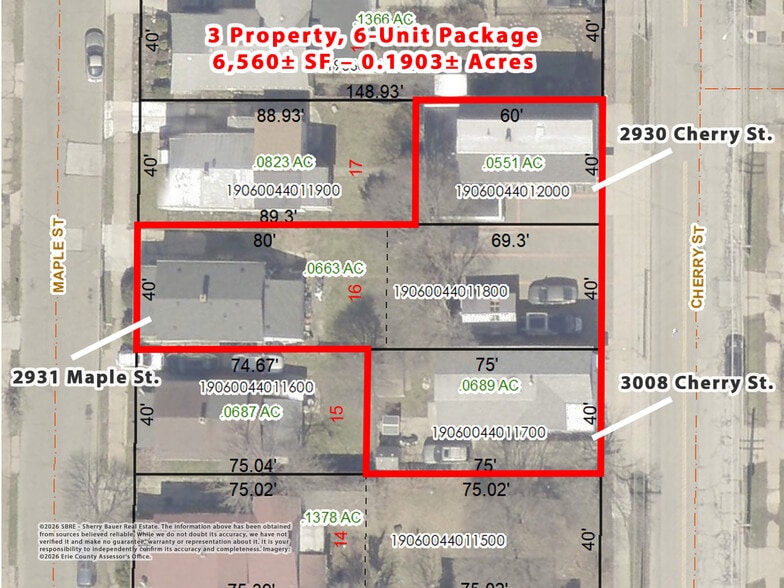
- 6-Unit, 3 Property Mixed-Use Investment Package Totaling 6,560± SF
- 1 Commercial Unit & 5 Residential Units - 83% Occupancy With Excellent Rental History
- Upside Potential With Below Market Rental Rates
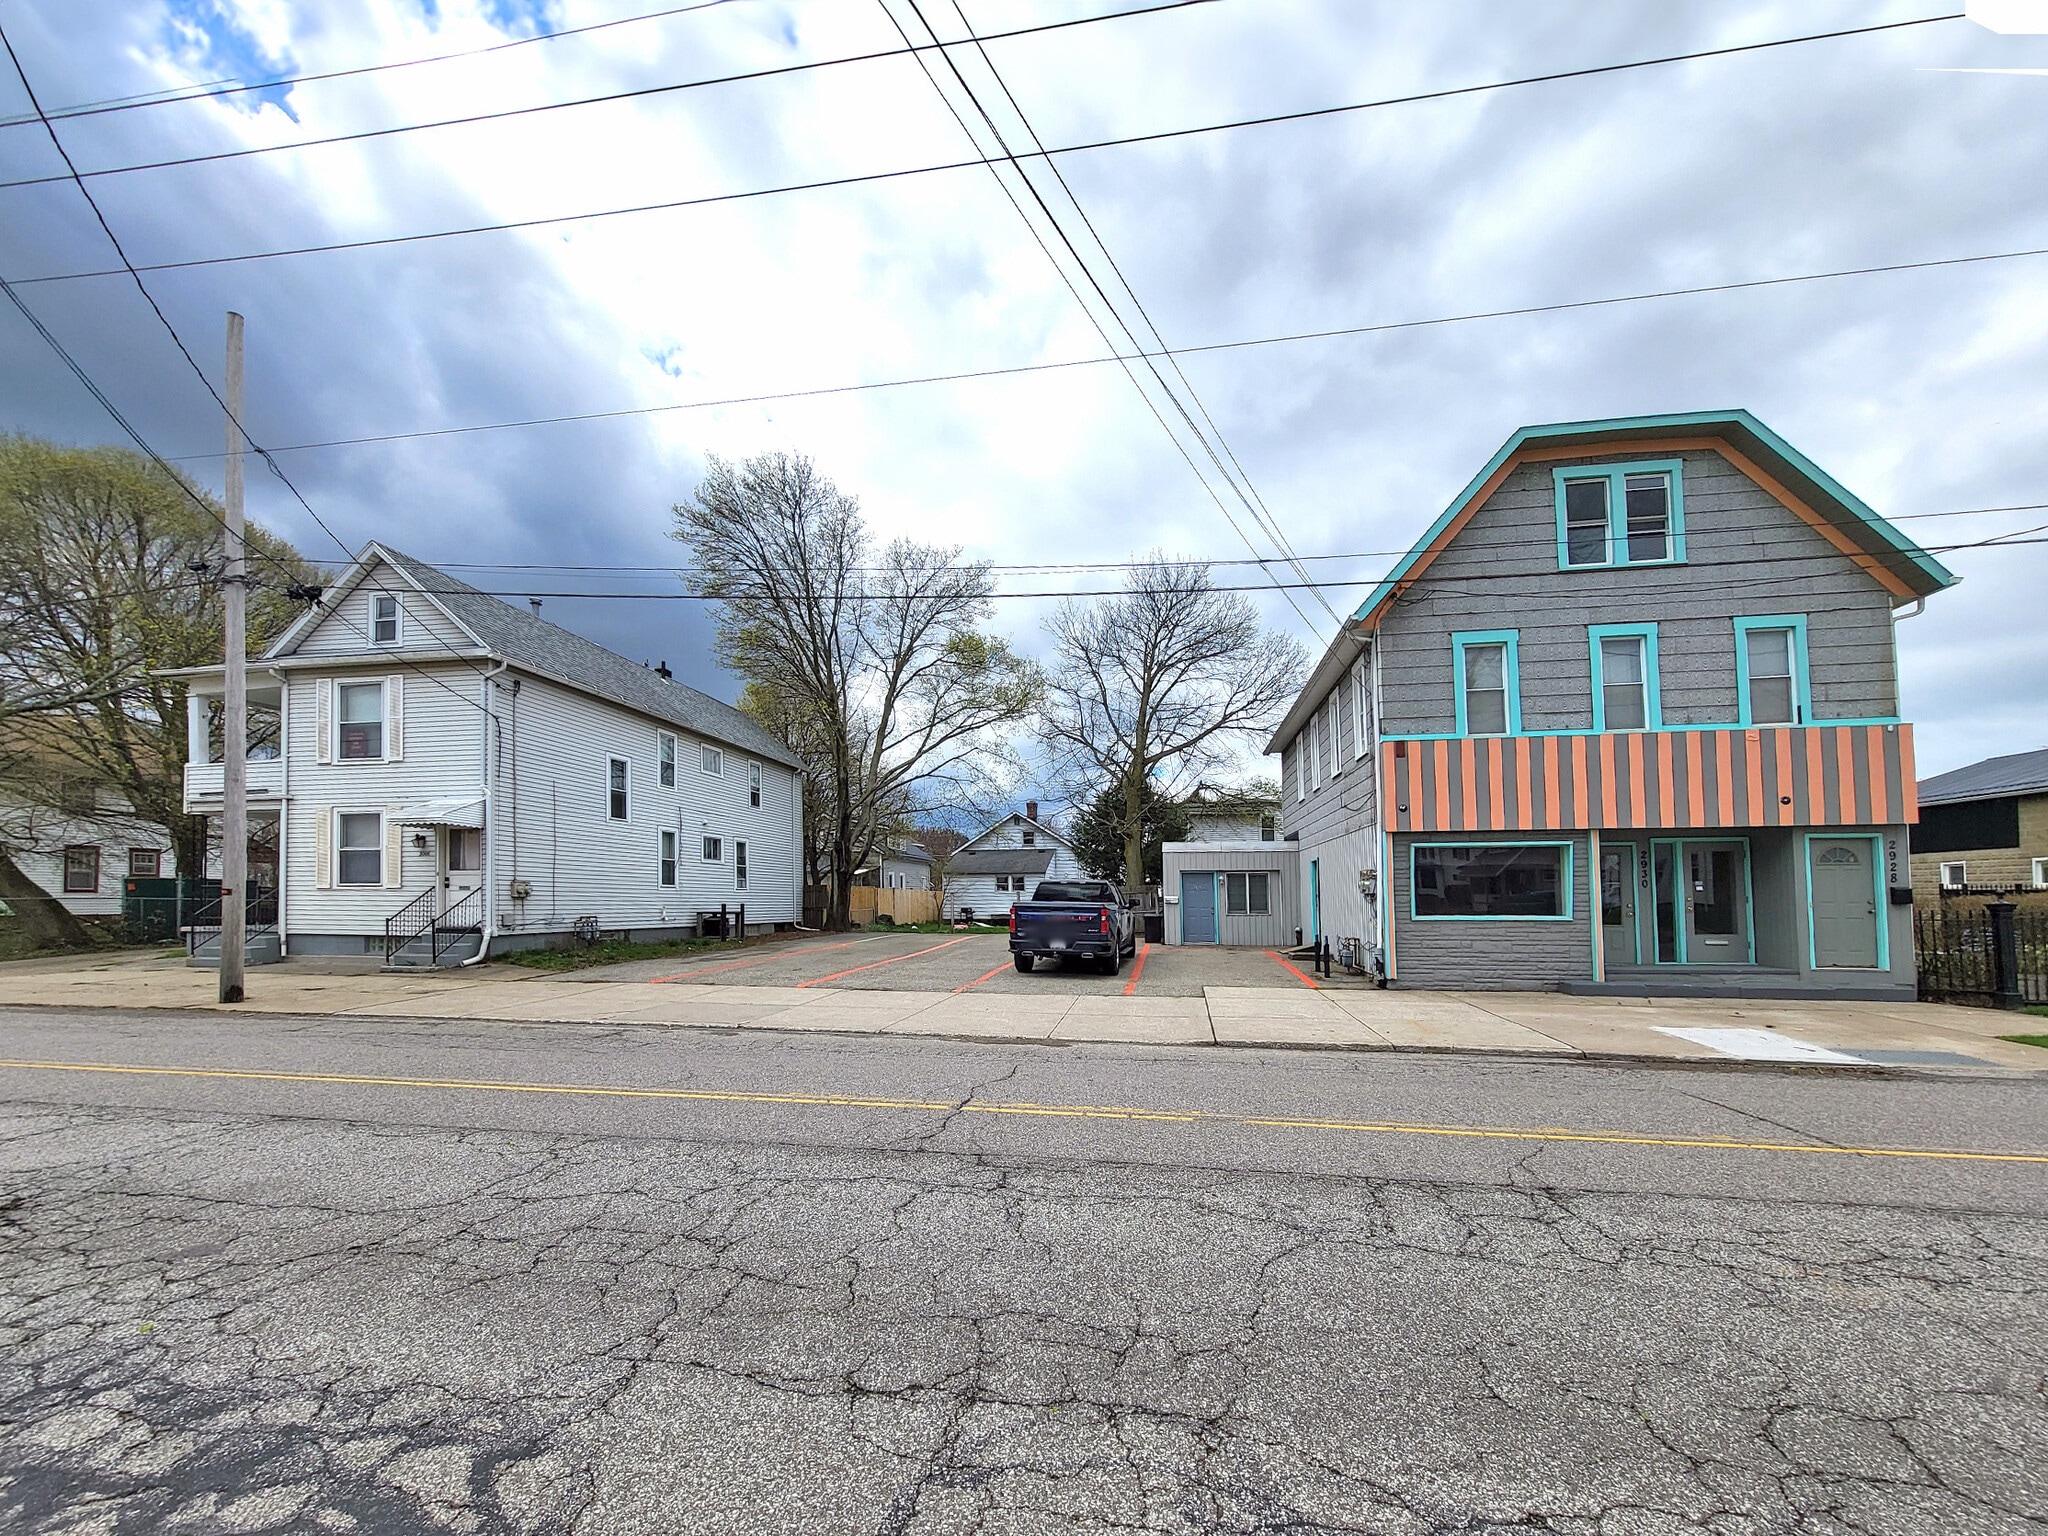
- Comprised Of 3 Contiguous Parcels Totaling 0.19± Acres With Parking For ±14
- $54,615 Annual Income & $42,040 Net Operating Income (2025 Actual)
- $70,053 Pro Forma Annual Income - $57,959 Pro Forma NOI - 9% Pro Forma Cap Rate
Executive Summary
6-Unit, mixed-use investment package for sale. Comprised of 3 contiguous parcels totaling 0.19± acres with 1 commercial unit & 5 residential rentals. 83% occupancy with excellent income history. $54,615 annual income & $42,040 net operating income (actual - 2025). Upside potential with below market rents. Unit mix includes 911± SF office/storefront, one 1 bedroom/1 bathroom apartment, one 2 bedroom/1 bathroom apartment, one 3 bedroom/1 bathroom single family home & two 3 bedroom/1 bathroom apartments. Off-street parking for ±14 with paved parking lot for ±9 and two private driveways plus on-street parking. All units are separately metered for gas &/or electric (one unit all electric). Centrally located just 0.4 miles (3 blocks) from Erie High School, the City’s only high school, and near Peach Street’s retail/service corridor and multiple public bus routes. Zoned Traditional Single Family Development (R-1A) in the City of Erie’s west side. $70,053 pro forma annual income - $57,959 pro forma NOI. Offered at $645,000 – 9.0% pro forma cap rate. Contact broker for additional details.
Financial Summary (Pro Forma - 2026) |
Annual (CAD) | Annual Per SF (CAD) |
|---|---|---|
| Gross Rental Income |
$104,986

|
$21.11
|
| Other Income |
-
|
-
|
| Vacancy Loss |
$5,249
|
$1.06
|
| Effective Gross Income |
$99,737
|
$20.05
|
| Taxes |
$10,600
|
$2.13
|
| Operating Expenses |
$6,619
|
$1.33
|
| Total Expenses |
$17,219
|
$3.46
|
| Net Operating Income |
$82,518
|
$16.59
|
Financial Summary (Pro Forma - 2026)
| Gross Rental Income (CAD) | |
|---|---|
| Annual | $104,986 |
| Annual Per SF | $21.11 |
| Other Income (CAD) | |
|---|---|
| Annual | - |
| Annual Per SF | - |
| Vacancy Loss (CAD) | |
|---|---|
| Annual | $5,249 |
| Annual Per SF | $1.06 |
| Effective Gross Income (CAD) | |
|---|---|
| Annual | $99,737 |
| Annual Per SF | $20.05 |
| Taxes (CAD) | |
|---|---|
| Annual | $10,600 |
| Annual Per SF | $2.13 |
| Operating Expenses (CAD) | |
|---|---|
| Annual | $6,619 |
| Annual Per SF | $1.33 |
| Total Expenses (CAD) | |
|---|---|
| Annual | $17,219 |
| Annual Per SF | $3.46 |
| Net Operating Income (CAD) | |
|---|---|
| Annual | $82,518 |
| Annual Per SF | $16.59 |
Property Facts
Unit Mix Information
| Description | No. Units | Avg. Rent/Mo | SF |
|---|---|---|---|
| 1+1 | 1 | - | - |
| 2+1 | 1 | - | - |
| 3+1 | 3 | - | 855 - 1,202 |
1 1
Moderately walkable
70/100
Moderately drivable
60/100
Limited public transit
30/100
Fairly bikeable
40/100
Property Taxes
| Parcel Number | 19-060-044.0-120.00 | Total Assessment | $91,202 CAD |
| Land Assessment | $16,683 CAD | Annual Taxes | $10,600 CAD ($1.62 CAD/SF) |
| Improvements Assessment | $74,518 CAD | Tax Year | 2026 Payable 2026 |
Property Taxes
Parcel Number
19-060-044.0-120.00
Land Assessment
$16,683 CAD
Improvements Assessment
$74,518 CAD
Total Assessment
$91,202 CAD
Annual Taxes
$10,600 CAD ($1.62 CAD/SF)
Tax Year
2026 Payable 2026

1 of 30
Videos
Matterport 3D Exterior
Matterport 3D Tour
Photos
Street View
Street
Map
1 of 1
Presented by
6-Unit, Mixed-Use Investment Property | 2930 Cherry St
Already a member? Log In
Hmm, there seems to have been an error sending your message. Please try again.
Thanks! Your message was sent.