Log In/Sign Up
Your email has been sent.
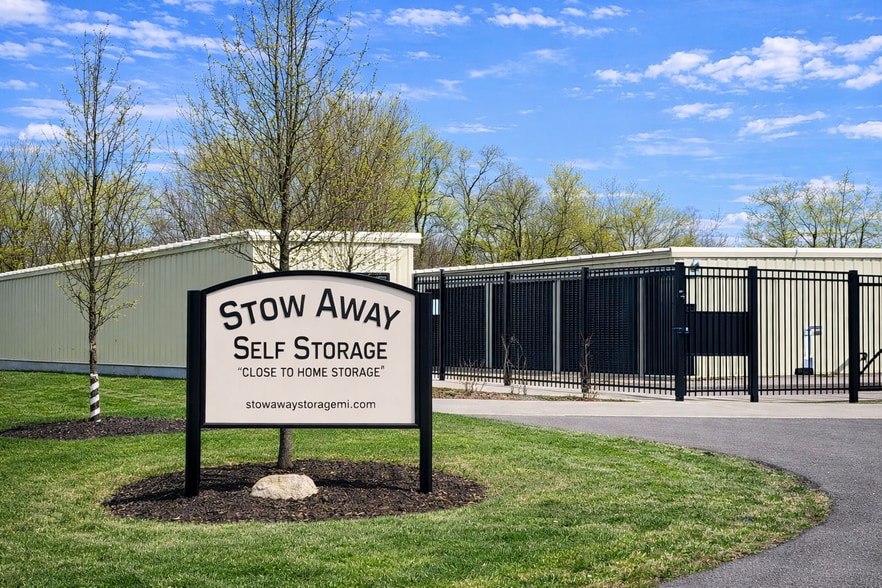
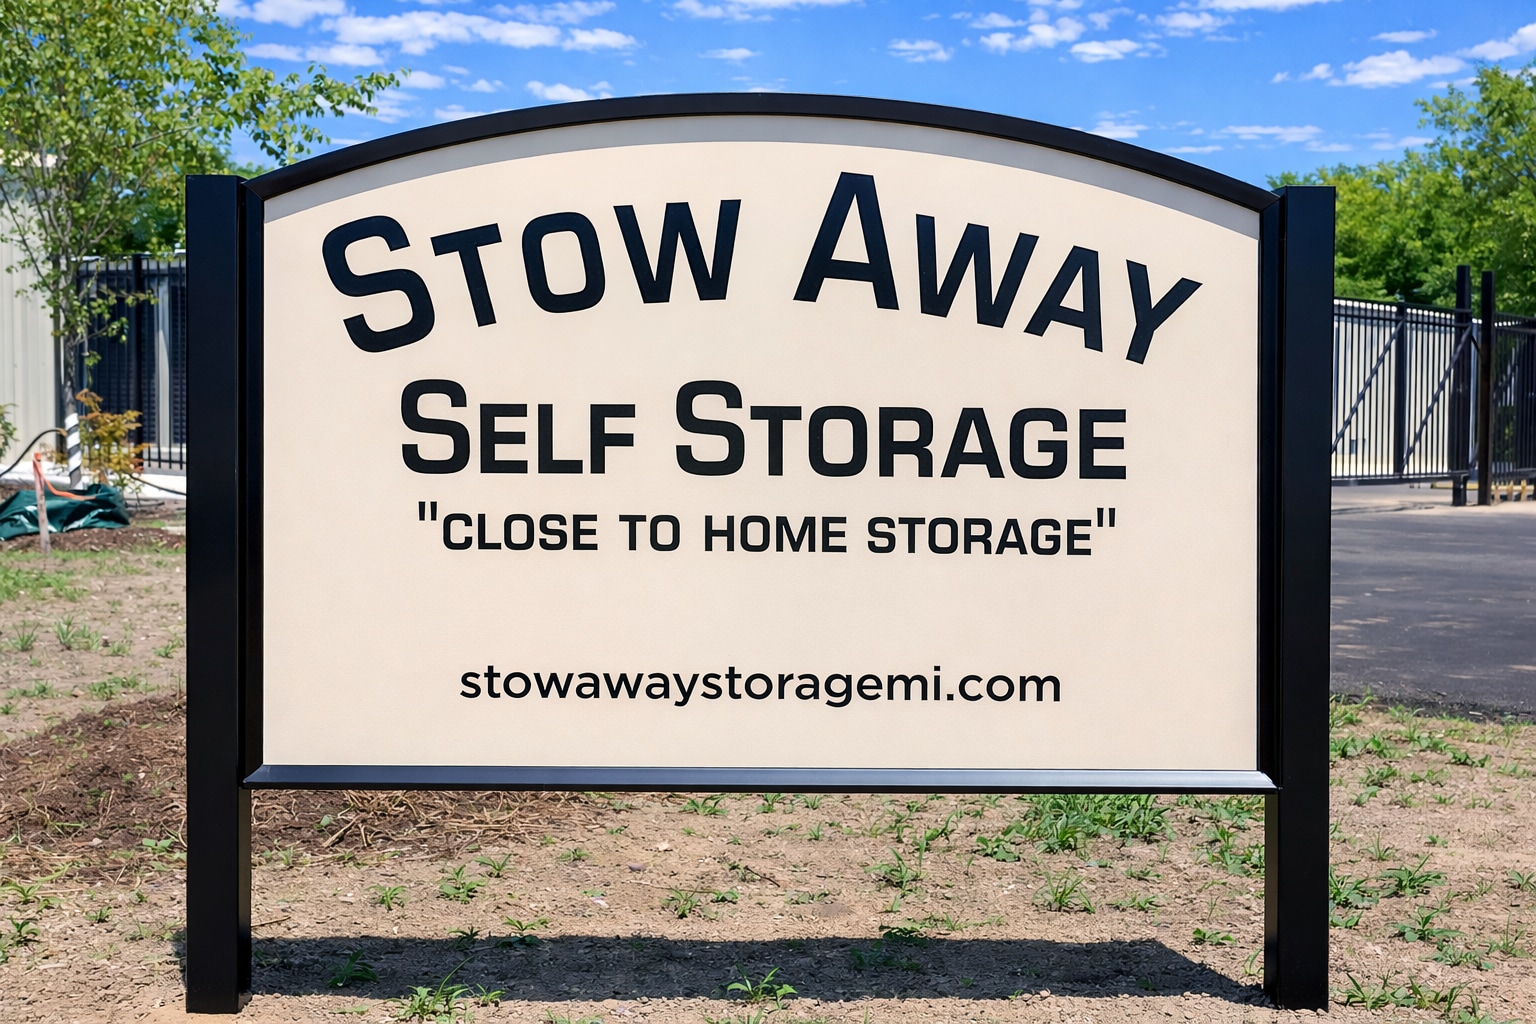
353 E First St 12,300 SF Specialty Building Offered at $1,709,412 CAD at a 6.20% Cap Rate in Fennville, MI 49408

Investment Highlights
- 138 Units | 12,780 Net Rentable SF 76% Occupancy
- Proven Operating History with in-place cash flow
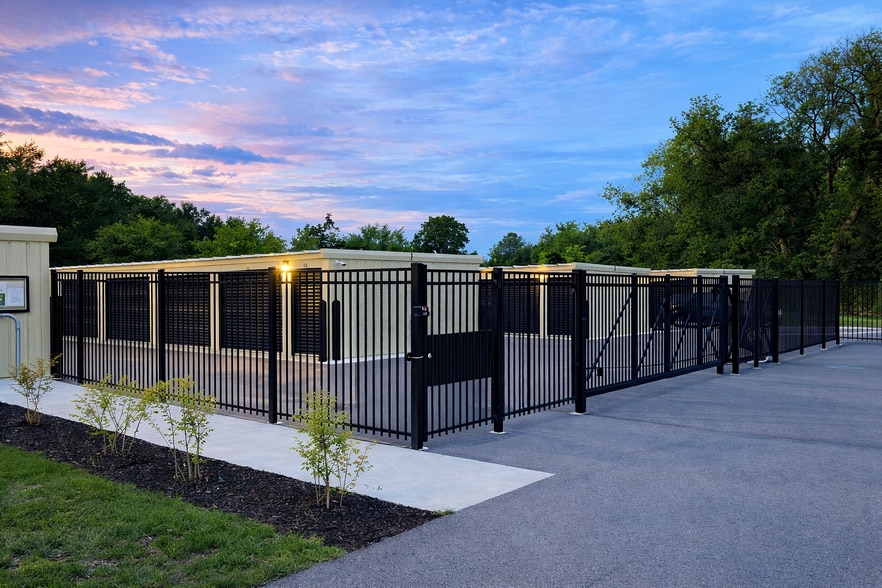
- Recently Built Construction – Modern design and layout
Executive Summary
Please Contact Danielle Moore at 586.354.4433 with all inquiries!
Status: Professionally managed, recently built, well-maintained
Occupancy: ~76% and still leasing up
Financial Performance:
2024 Gross Revenue: $126,343
2025 Revenue: $134,314.54
Expenses: $56,832.12
NOI: $77,482.42
Upside Potential:
Continued lease-up driving revenue growth
Strong local fundamentals and demand drivers
Area revitalization underway, including a grant-funded historic hotel renovation and multiple community development projects supporting long-term value appreciation
Low-maintenance, updated facility with proven operational history
Financial Summary (Actual - 2025) |
Annual (CAD) | Annual Per SF (CAD) |
|---|---|---|
| Gross Rental Income |
$183,678

|
$14.93
|
| Other Income |
-
|
-
|
| Vacancy Loss |
-
|
-
|
| Effective Gross Income |
$183,678
|
$14.93
|
| Taxes |
-
|
-
|
| Operating Expenses |
-
|
-
|
| Total Expenses |
$77,719
|
$6.32
|
| Net Operating Income |
$105,959
|
$8.61
|
Financial Summary (Actual - 2025)
| Gross Rental Income (CAD) | |
|---|---|
| Annual | $183,678 |
| Annual Per SF | $14.93 |
| Other Income (CAD) | |
|---|---|
| Annual | - |
| Annual Per SF | - |
| Vacancy Loss (CAD) | |
|---|---|
| Annual | - |
| Annual Per SF | - |
| Effective Gross Income (CAD) | |
|---|---|
| Annual | $183,678 |
| Annual Per SF | $14.93 |
| Taxes (CAD) | |
|---|---|
| Annual | - |
| Annual Per SF | - |
| Operating Expenses (CAD) | |
|---|---|
| Annual | - |
| Annual Per SF | - |
| Total Expenses (CAD) | |
|---|---|
| Annual | $77,719 |
| Annual Per SF | $6.32 |
| Net Operating Income (CAD) | |
|---|---|
| Annual | $105,959 |
| Annual Per SF | $8.61 |
Property Facts
| Price | $1,709,412 CAD | Building Class | B |
| Price Per SF | $138.98 CAD | Lot Size | 1.02 AC |
| Sale Type | Investment | Building Size | 12,300 SF |
| Cap Rate | 6.20% | No. Stories | 1 |
| Property Type | Specialty | Year Built | 2020 |
| Property Subtype | Self-Storage | Parking Ratio | 0.41/1,000 SF |
| Zoning | Special | ||
| Price | $1,709,412 CAD |
| Price Per SF | $138.98 CAD |
| Sale Type | Investment |
| Cap Rate | 6.20% |
| Property Type | Specialty |
| Property Subtype | Self-Storage |
| Building Class | B |
| Lot Size | 1.02 AC |
| Building Size | 12,300 SF |
| No. Stories | 1 |
| Year Built | 2020 |
| Parking Ratio | 0.41/1,000 SF |
| Zoning | Special |
1 1
Property Taxes
| Parcel Number | 52-700-009-00 | Improvements Assessment | $0 CAD |
| Land Assessment | $0 CAD | Total Assessment | $302,917 CAD |
Property Taxes
Parcel Number
52-700-009-00
Land Assessment
$0 CAD
Improvements Assessment
$0 CAD
Total Assessment
$302,917 CAD


1 of 10
Videos
Matterport 3D Exterior
Matterport 3D Tour
Photos
Street View
Street
Map
1 of 1
Presented by
Realty Executives Showcase Commercial
353 E First St
Already a member? Log In
Hmm, there seems to have been an error sending your message. Please try again.
Thanks! Your message was sent.