Log In/Sign Up
Your email has been sent.
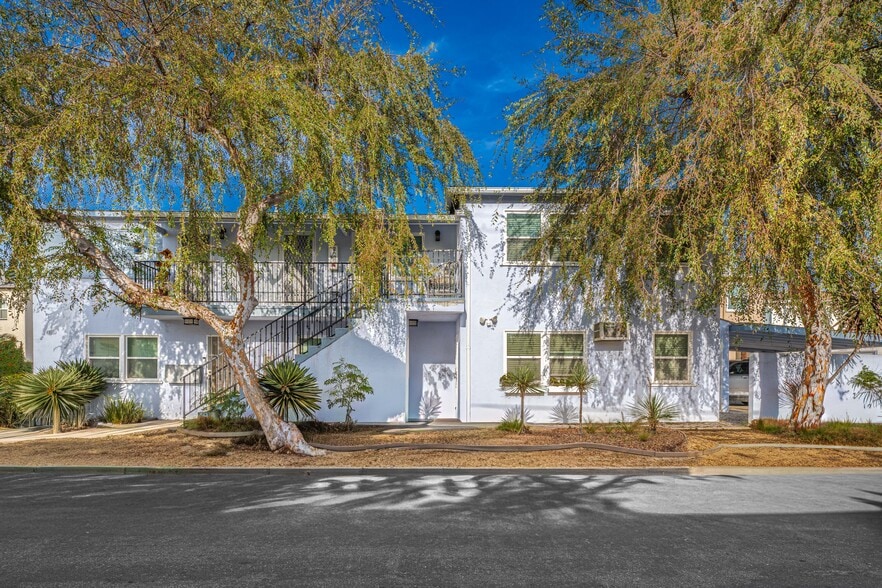
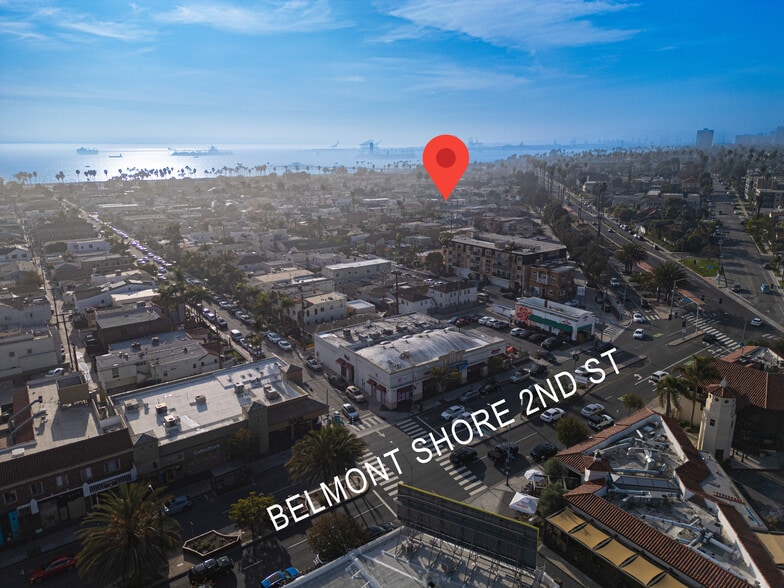
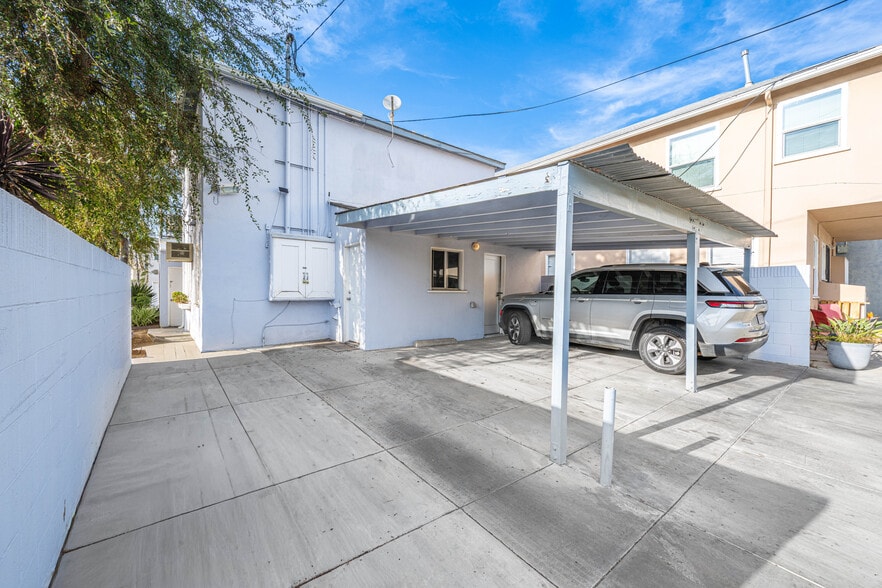
4401 E Division St 5 Unit Apartment Building $2,669,023 CAD ($533,805 CAD/Unit) 3.75% Cap Rate Long Beach, CA 90803
Investment Highlights
- Belmont Shore is between the 2nd St Promenade and the ocean. Easy walking distance to both. Units don't turn overmuch in our building. Great tenants!
Financial Summary (Actual - 2025) Click Here to Access |
Annual (CAD) | Annual Per SF (CAD) |
|---|---|---|
| Gross Rental Income |
$99,999

|
$9.99
|
| Other Income |
$99,999
|
$9.99
|
| Vacancy Loss |
$99,999
|
$9.99
|
| Effective Gross Income |
$99,999
|
$9.99
|
| Taxes |
$99,999
|
$9.99
|
| Operating Expenses |
$99,999
|
$9.99
|
| Total Expenses |
$99,999
|
$9.99
|
| Net Operating Income |
$99,999
|
$9.99
|
Financial Summary (Actual - 2025) Click Here to Access
| Gross Rental Income (CAD) | |
|---|---|
| Annual | $99,999 |
| Annual Per SF | $9.99 |
| Other Income (CAD) | |
|---|---|
| Annual | $99,999 |
| Annual Per SF | $9.99 |
| Vacancy Loss (CAD) | |
|---|---|
| Annual | $99,999 |
| Annual Per SF | $9.99 |
| Effective Gross Income (CAD) | |
|---|---|
| Annual | $99,999 |
| Annual Per SF | $9.99 |
| Taxes (CAD) | |
|---|---|
| Annual | $99,999 |
| Annual Per SF | $9.99 |
| Operating Expenses (CAD) | |
|---|---|
| Annual | $99,999 |
| Annual Per SF | $9.99 |
| Total Expenses (CAD) | |
|---|---|
| Annual | $99,999 |
| Annual Per SF | $9.99 |
| Net Operating Income (CAD) | |
|---|---|
| Annual | $99,999 |
| Annual Per SF | $9.99 |
Property Facts
| Price | $2,669,023 CAD | Apartment Style | Low-Rise |
| Price Per Unit | $533,805 CAD | Building Class | C |
| Sale Type | Investment | Lot Size | 0.08 AC |
| Cap Rate | 3.75% | Building Size | 2,628 SF |
| Gross Rent Multiplier | 16.8 | No. Stories | 2 |
| No. Units | 5 | Year Built | 1953 |
| Property Type | Multifamily | Parking Ratio | 1.14/1,000 SF |
| Property Subtype | Apartment | ||
| Zoning | R2 - Residential | ||
| Price | $2,669,023 CAD |
| Price Per Unit | $533,805 CAD |
| Sale Type | Investment |
| Cap Rate | 3.75% |
| Gross Rent Multiplier | 16.8 |
| No. Units | 5 |
| Property Type | Multifamily |
| Property Subtype | Apartment |
| Apartment Style | Low-Rise |
| Building Class | C |
| Lot Size | 0.08 AC |
| Building Size | 2,628 SF |
| No. Stories | 2 |
| Year Built | 1953 |
| Parking Ratio | 1.14/1,000 SF |
| Zoning | R2 - Residential |
Amenities
Unit Amenities
- Heating
- Kitchen
- Refrigerator
- Range
- Tub/Shower
Site Amenities
- Laundry Facilities
Unit Mix Information
| Description | No. Units | Avg. Rent/Mo | SF |
|---|---|---|---|
| Studios | 2 | $3,935 CAD | - |
| 1+1 | 2 | $5,543 CAD | - |
| 2+1 | 1 | $3,764 CAD | - |

Walk Score®
Very Walkable (87)
Bike Score®
Very Bikeable (75)
Property Taxes
| Parcel Number | 7256-025-012 | Total Assessment | $2,026,338 CAD |
| Land Assessment | $1,320,332 CAD | Annual Taxes | -$1 CAD ($0.00 CAD/SF) |
| Improvements Assessment | $706,006 CAD | Tax Year | 2025 |
Property Taxes
Parcel Number
7256-025-012
Land Assessment
$1,320,332 CAD
Improvements Assessment
$706,006 CAD
Total Assessment
$2,026,338 CAD
Annual Taxes
-$1 CAD ($0.00 CAD/SF)
Tax Year
2025

1 of 5
Videos
Matterport 3D Exterior
Matterport 3D Tour
Photos
Street View
Street
Map

Presented by
First Manhattan Realtors
4401 E Division St
Already a member? Log In
Hmm, there seems to have been an error sending your message. Please try again.
Thanks! Your message was sent.