Log In/Sign Up
Your email has been sent.
860 W Main St 4,224 SF 100% Leased Flex Building Spartanburg, SC 29301 $1,046,399 CAD ($247.73 CAD/SF) 8.55% Cap Rate
INVESTMENT HIGHLIGHTS
- Fully leased 4,224 SF flex building offering a strong 10.68% cap rate and stable annual NOI of $64,000–$67,000.
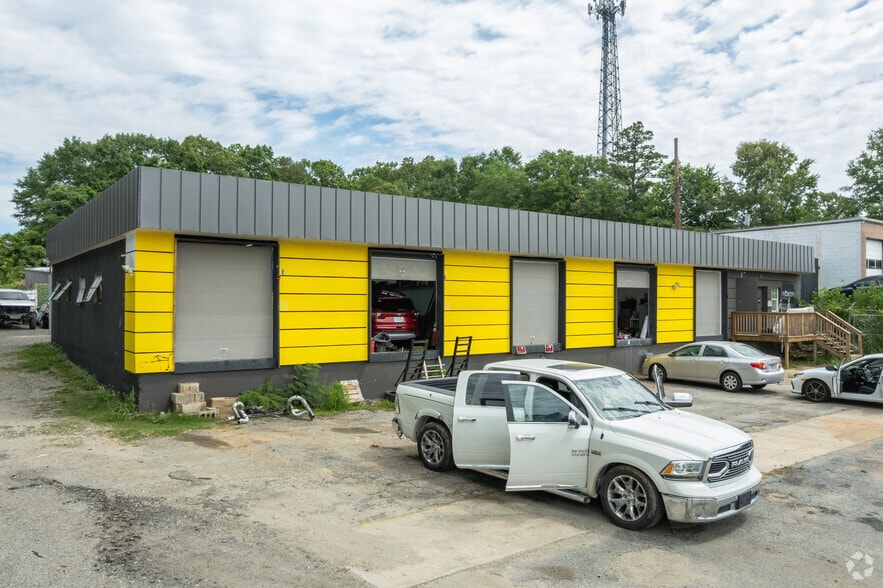
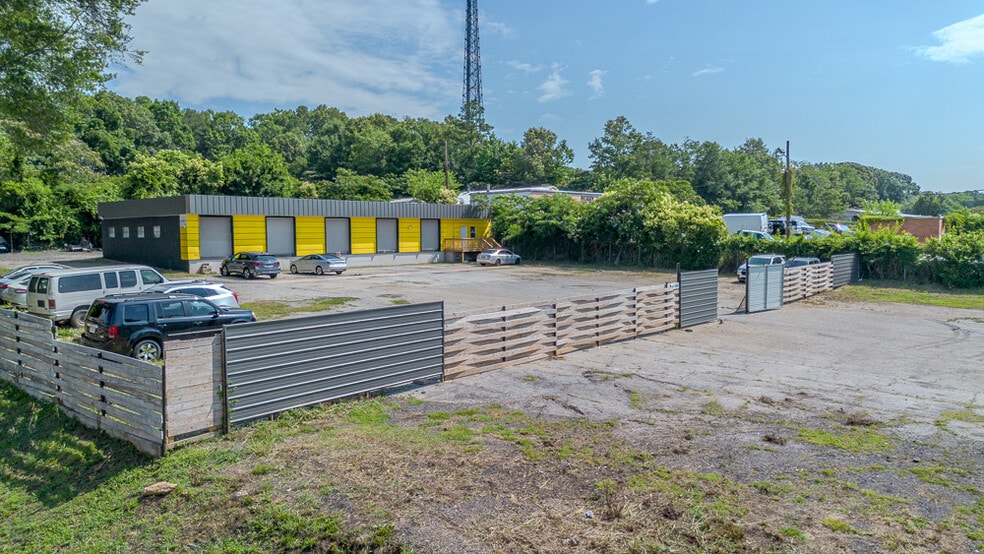
- Features 5 bays with roll-up doors, 7 dock-high loading areas, 2 offices, and 3 restrooms, providing versatile space for various businesses.
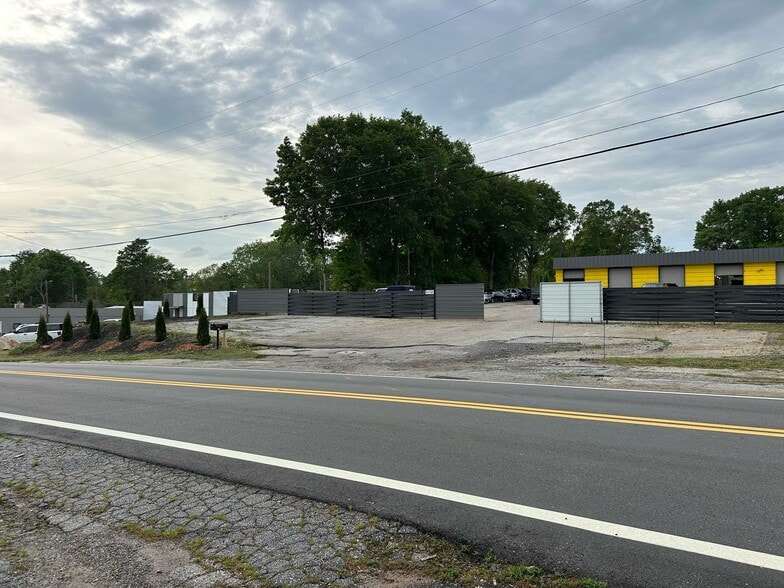
- Prime location in Spartanburg’s high-traffic industrial area, just minutes from downtown, shopping, and hotels.
- Recent upgrades include a brand-new roof and a fenced 1-acre lot, ensuring security and privacy for tenants and owners.
EXECUTIVE SUMMARY
860 W Main Street is a fully leased, 4,224 square foot investment opportunity. This light distribution property offers a stable annualized return with strong cash flow. Situated on a 1-acre fenced lot, the property features 5 bays with roll-up doors, 7 dock-high loading areas, 2 offices, and 3 restrooms—ideal for light industrial, distribution, or service-based tenants. Recent upgrades include a brand-new roof, and the site provides ample parking with a high 17.76/1,000 SF ratio. Conveniently located in a high-traffic industrial corridor just minutes from downtown Spartanburg, shopping centers, and hotels, this property sits in an Opportunity Zone and is zoned CI (Commercial Industrial), offering long-term value for investors or potential owner-users.
FINANCIAL SUMMARY (ACTUAL - 2024) |
ANNUAL (CAD) | ANNUAL PER SF (CAD) |
|---|---|---|
| Gross Rental Income |
$102,129

|
$24.18
|
| Other Income |
$11,301
|
$2.68
|
| Vacancy Loss |
-
|
-
|
| Effective Gross Income |
$113,430
|
$26.85
|
| Taxes |
$8,208
|
$1.94
|
| Operating Expenses |
$12,152
|
$2.88
|
| Total Expenses |
$20,360
|
$4.82
|
| Net Operating Income |
$93,070
|
$22.03
|
FINANCIAL SUMMARY (ACTUAL - 2024)
| Gross Rental Income (CAD) | |
|---|---|
| Annual | $102,129 |
| Annual Per SF | $24.18 |
| Other Income (CAD) | |
|---|---|
| Annual | $11,301 |
| Annual Per SF | $2.68 |
| Vacancy Loss (CAD) | |
|---|---|
| Annual | - |
| Annual Per SF | - |
| Effective Gross Income (CAD) | |
|---|---|
| Annual | $113,430 |
| Annual Per SF | $26.85 |
| Taxes (CAD) | |
|---|---|
| Annual | $8,208 |
| Annual Per SF | $1.94 |
| Operating Expenses (CAD) | |
|---|---|
| Annual | $12,152 |
| Annual Per SF | $2.88 |
| Total Expenses (CAD) | |
|---|---|
| Annual | $20,360 |
| Annual Per SF | $4.82 |
| Net Operating Income (CAD) | |
|---|---|
| Annual | $93,070 |
| Annual Per SF | $22.03 |
PROPERTY FACTS
AMENITIES
- 24 Hour Access
- Courtyard
- Fenced Lot
- Front Loading
- Security System
- Storage Space
- Smoke Detector
UTILITIES
- Lighting
- Gas
- Water
- Sewer
- Heating


DEMOGRAPHICS
REGIONAL ACCESSIBILITY
CITY
POPULATION
MILES
DRIVE TIME
Charlotte
872,498
72
1 h 34 m
Nashville
669,053
353
6 h 46 m
Jacksonville
903,889
375
6 h 54 m
Columbus
892,533
466
9 h 25 m
Washington
702,455
469
9 h 8 m
Indianapolis
867,125
512
10 h 2 m
ACCESS AND LABOR FORCE
10 MILES
Total Population
207,937
Total Labor Force
113,324
Unemployment Rate
3.36%
Median Household Income
$58,371
Warehouse Employees
29,360
High School Education Or Higher
88.50%
$ values in USD
PROPERTY TAXES
| Parcel Number | 7-11-16-008.00 | Total Assessment | $16,742 CAD (2025) |
| Land Assessment | $7,166 CAD (2025) | Annual Taxes | $8,208 CAD ($1.94 CAD/SF) |
| Improvements Assessment | $9,577 CAD (2025) | Tax Year | 2024 |
PROPERTY TAXES
Parcel Number
7-11-16-008.00
Land Assessment
$7,166 CAD (2025)
Improvements Assessment
$9,577 CAD (2025)
Total Assessment
$16,742 CAD (2025)
Annual Taxes
$8,208 CAD ($1.94 CAD/SF)
Tax Year
2024

1 of 40
VIDEOS
MATTERPORT 3D EXTERIOR
MATTERPORT 3D TOUR
PHOTOS
STREET VIEW
STREET
MAP

Presented by
Carolina Invest, LLC
860 W Main St
Already a member? Log In
Hmm, there seems to have been an error sending your message. Please try again.
Thanks! Your message was sent.