Log In/Sign Up
Your email has been sent.
Hartford Stabilized + Upside Portfolio 2 Properties Offered at $2,461,554 CAD in Hartford, CT

Investment Highlights
- Recent Capital Improvements
- Minimal near-term capital expenses—turnkey investment
- Separately metered utilities
- Strong value-add potential through tenant turnover and rent growth
- Large units with strong tenant demands
Executive Summary
Two-property multifamily portfolio located in Hartford, CT. Both assets have undergone recent renovations, including updated interiors, improved building systems, and new boilers, minimizing deferred maintenance and near-term capital expenditures. The properties are currently occupied with low vacancy, providing stable in-place cash flow from day one.
This offering presents a strong value-add component with projected upside to an 11% cap rate through strategic rent increases and natural tenant turnover. With solid rental demand and major capital improvements already completed, the portfolio offers a balanced opportunity for investors seeking both dependable current income and long-term NOI growth.
This offering presents a strong value-add component with projected upside to an 11% cap rate through strategic rent increases and natural tenant turnover. With solid rental demand and major capital improvements already completed, the portfolio offers a balanced opportunity for investors seeking both dependable current income and long-term NOI growth.
Taxes & Operating Expenses (Actual - 2025) Click Here to Access |
Annual (CAD) |
|---|---|
| Gross Rental Income |
$99,999

|
| Other Income |
-
|
| Vacancy Loss |
-
|
| Effective Gross Income |
$99,999
|
| Taxes |
$99,999
|
| Operating Expenses |
$99,999
|
| Total Expenses |
$99,999
|
| Net Operating Income |
$99,999
|
Taxes & Operating Expenses (Actual - 2025) Click Here to Access
| Gross Rental Income (CAD) | |
|---|---|
| Annual | $99,999 |
| Other Income (CAD) | |
|---|---|
| Annual | - |
| Vacancy Loss (CAD) | |
|---|---|
| Annual | - |
| Effective Gross Income (CAD) | |
|---|---|
| Annual | $99,999 |
| Taxes (CAD) | |
|---|---|
| Annual | $99,999 |
| Operating Expenses (CAD) | |
|---|---|
| Annual | $99,999 |
| Total Expenses (CAD) | |
|---|---|
| Annual | $99,999 |
| Net Operating Income (CAD) | |
|---|---|
| Annual | $99,999 |
Property Facts
| Price | $2,461,554 CAD | Number of Properties | 2 |
| Price / SF | $152.45 CAD / SF | Individually For Sale | 0 |
| Cap Rate | 8.50% | Total Building Size | 16,147 SF |
| Sale Type | Investment | Total Land Area | 0.37 AC |
| Status | Active |
| Price | $2,461,554 CAD |
| Price / SF | $152.45 CAD / SF |
| Cap Rate | 8.50% |
| Sale Type | Investment |
| Status | Active |
| Number of Properties | 2 |
| Individually For Sale | 0 |
| Total Building Size | 16,147 SF |
| Total Land Area | 0.37 AC |
Properties
| Property Name / Address | Property Type | Size | Year Built | Individual Price |
|---|---|---|---|---|
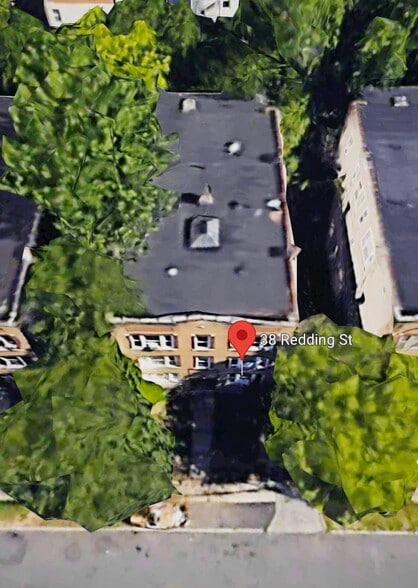
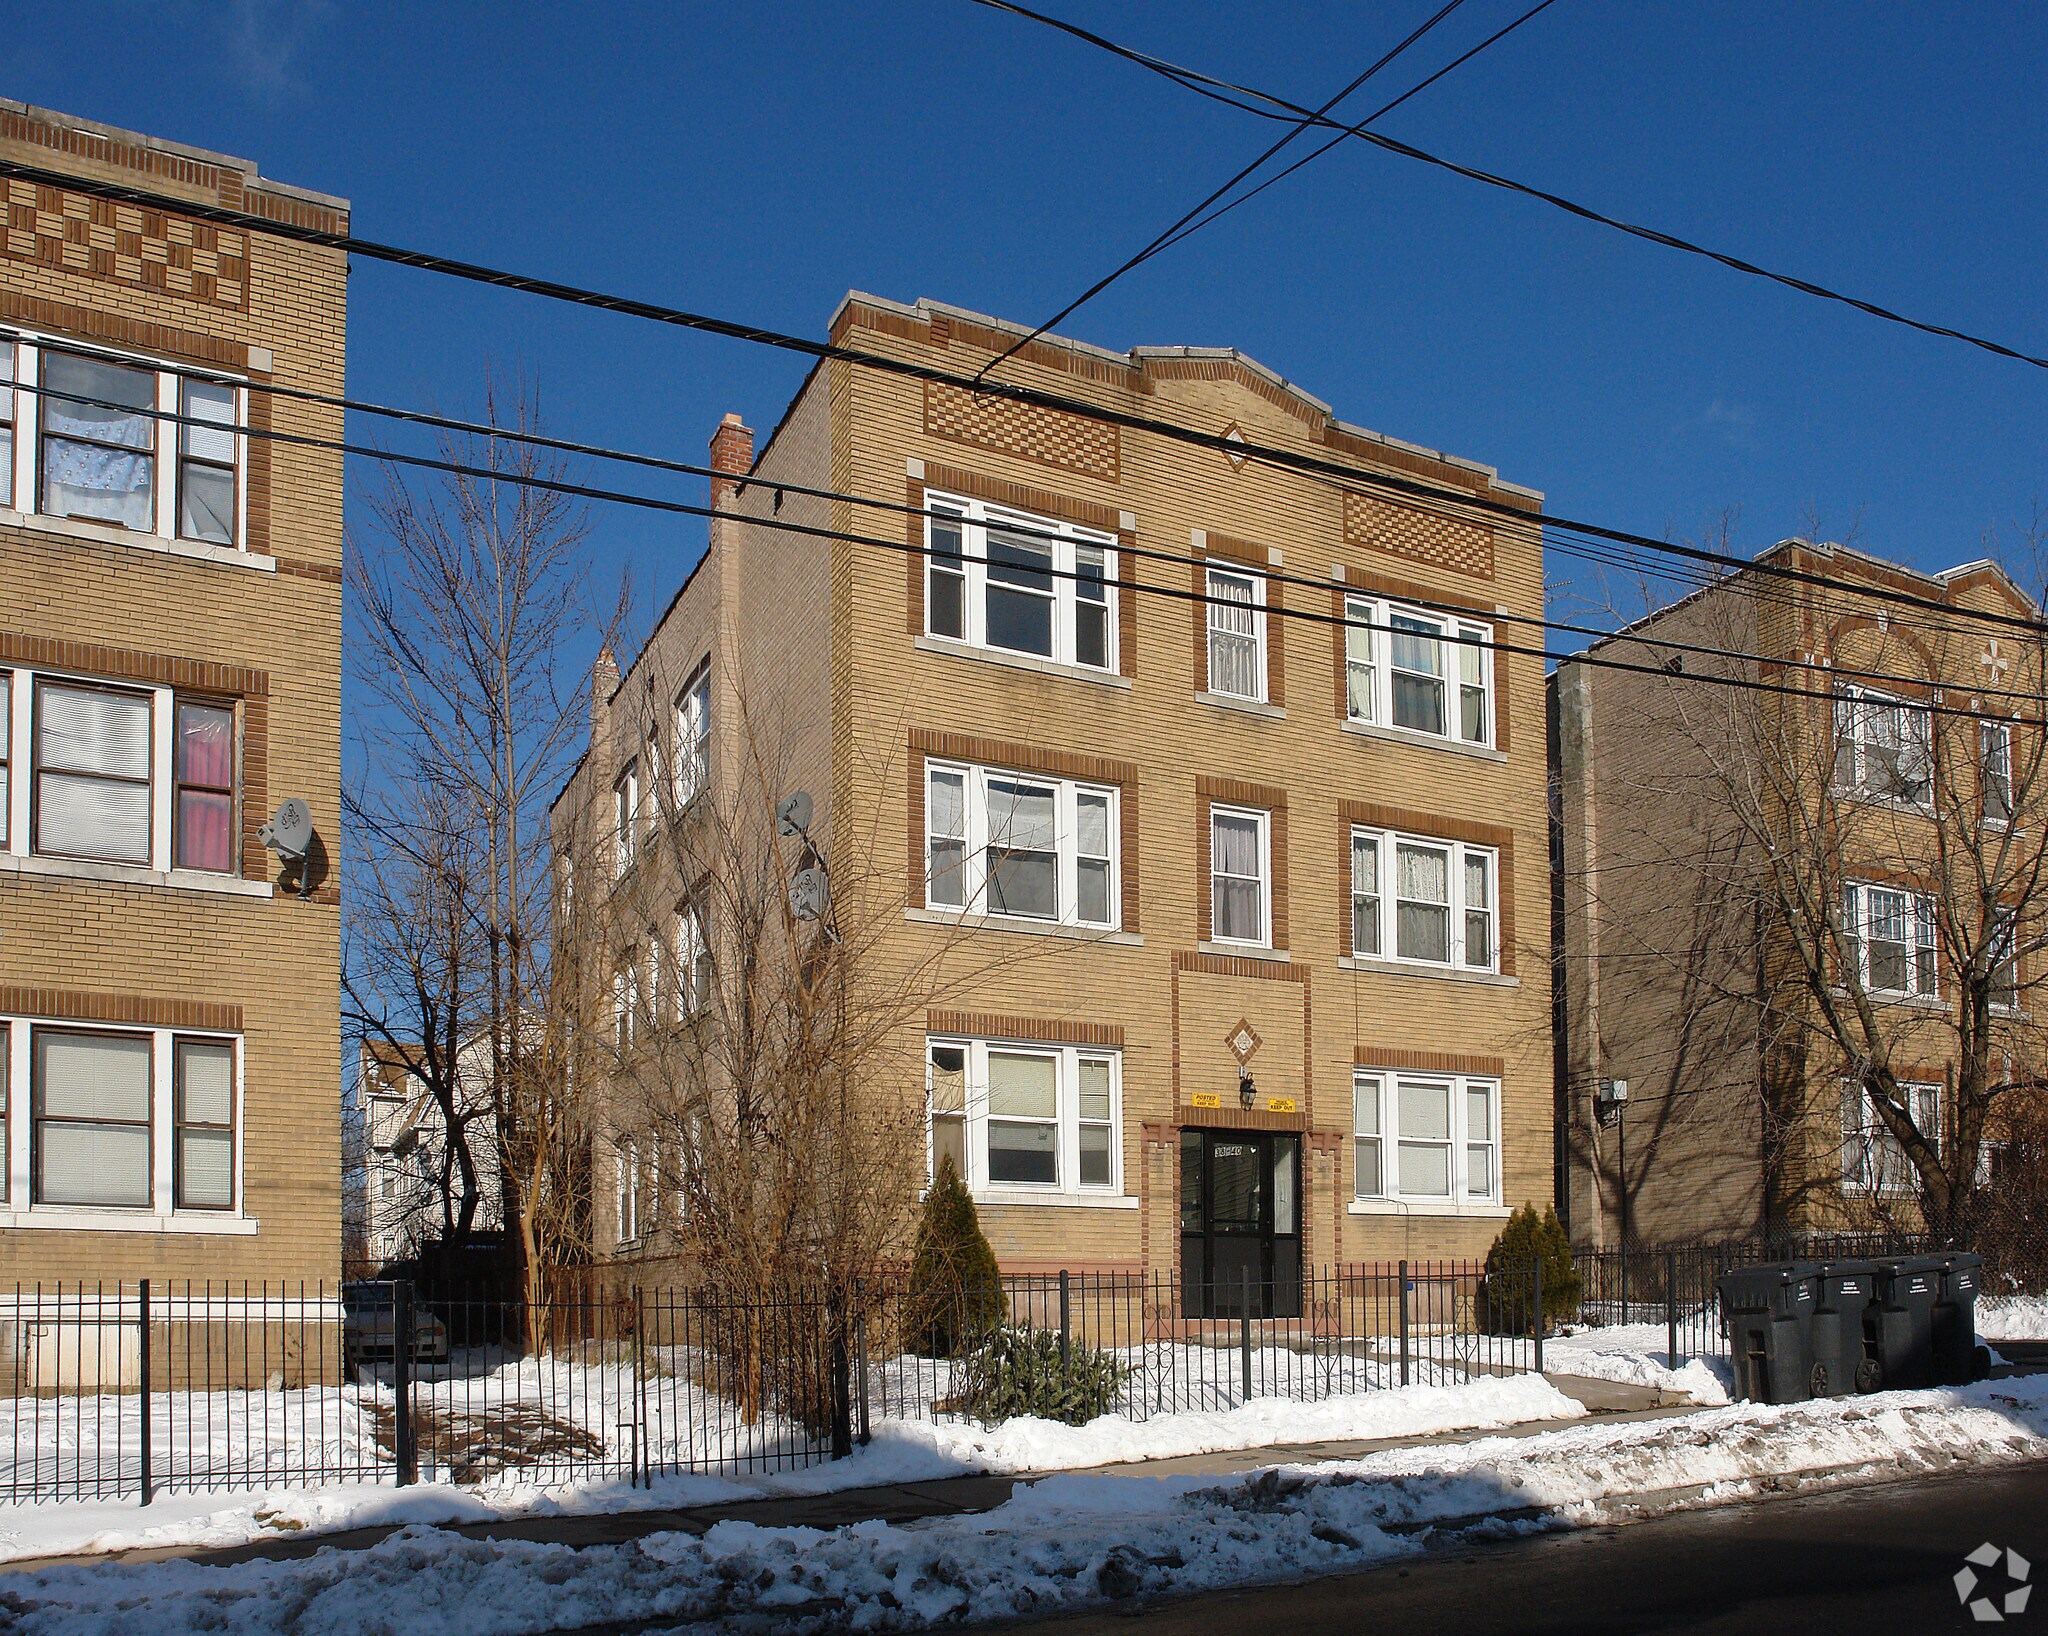
| 38-40 Redding St, Hartford, CT 06114 | Multifamily | 8,211 SF | 1926 | - |
|
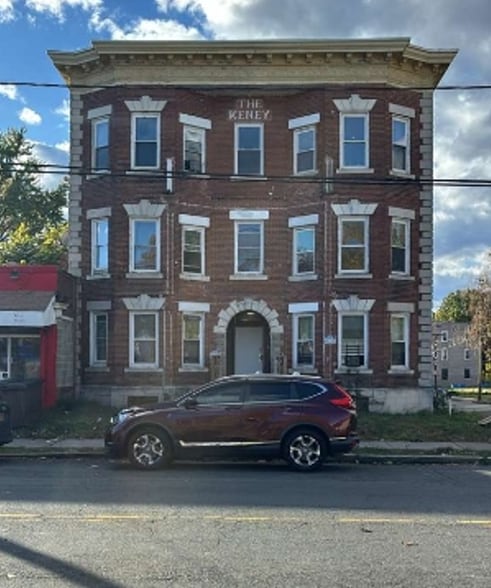
The Keney
89-93 Barbour St, Hartford, CT 06120 |
Retail | 7,936 SF | 1930 | - |
1 1

1 of 15
Videos
Matterport 3D Exterior
Matterport 3D Tour
Photos
Street View
Street
Map
1 of 1
Presented by
Y&S Property Management
Hartford Stabilized + Upside Portfolio
Already a member? Log In
Hmm, there seems to have been an error sending your message. Please try again.
Thanks! Your message was sent.