Se Connecter/S’inscrire
Votre courriel a été envoyé.

6-Unit, Mixed-Use Investment Property 2930 Cherry St 6 Unité Immeuble d’appartements 916 487 $ CAD (152 748 $ CAD/Unité) 8,99% Taux de capitalisation Erie, PA 16508
Certaines informations ont été traduites automatiquement.
Faits saillants de l'investissement
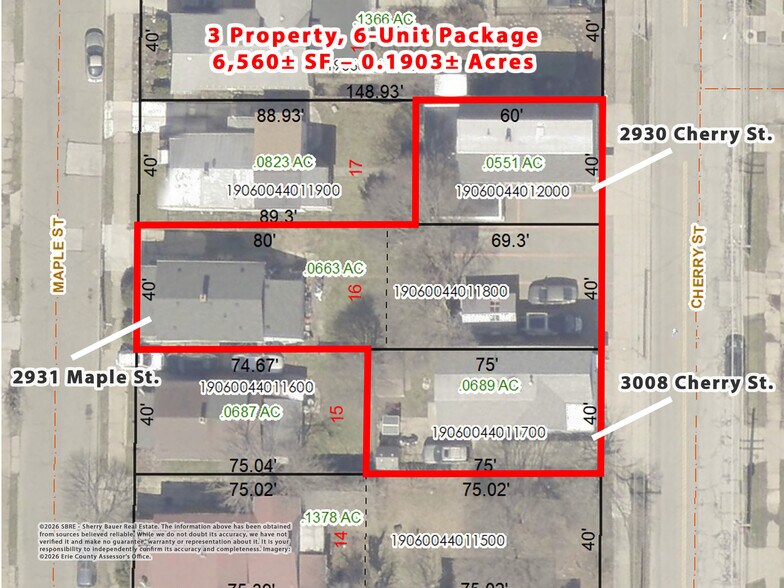
- 6-Unit, 3 Property Mixed-Use Investment Package Totaling 6,560± SF
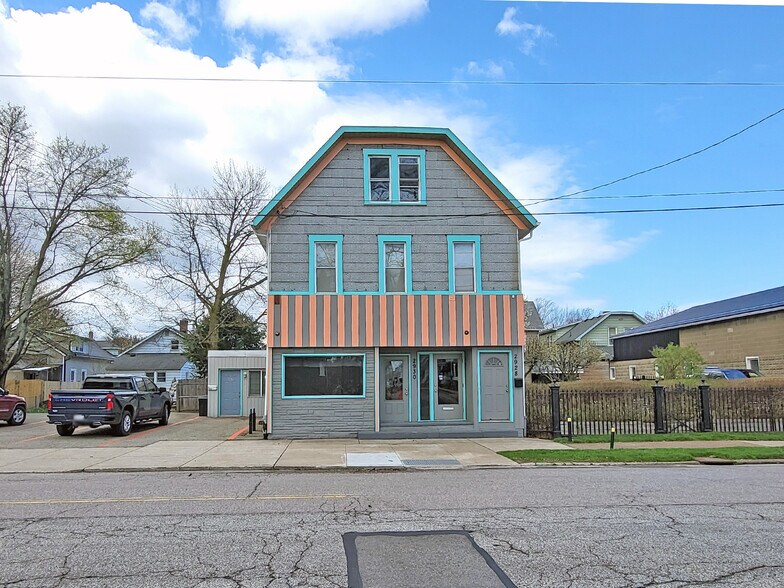
- 1 Commercial Unit & 5 Residential Units - 83% Occupancy With Excellent Rental History
- Upside Potential With Below Market Rental Rates
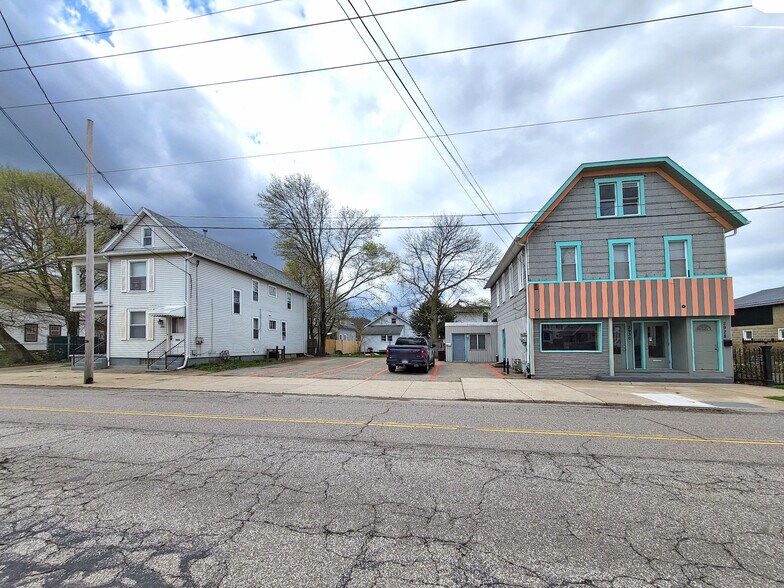
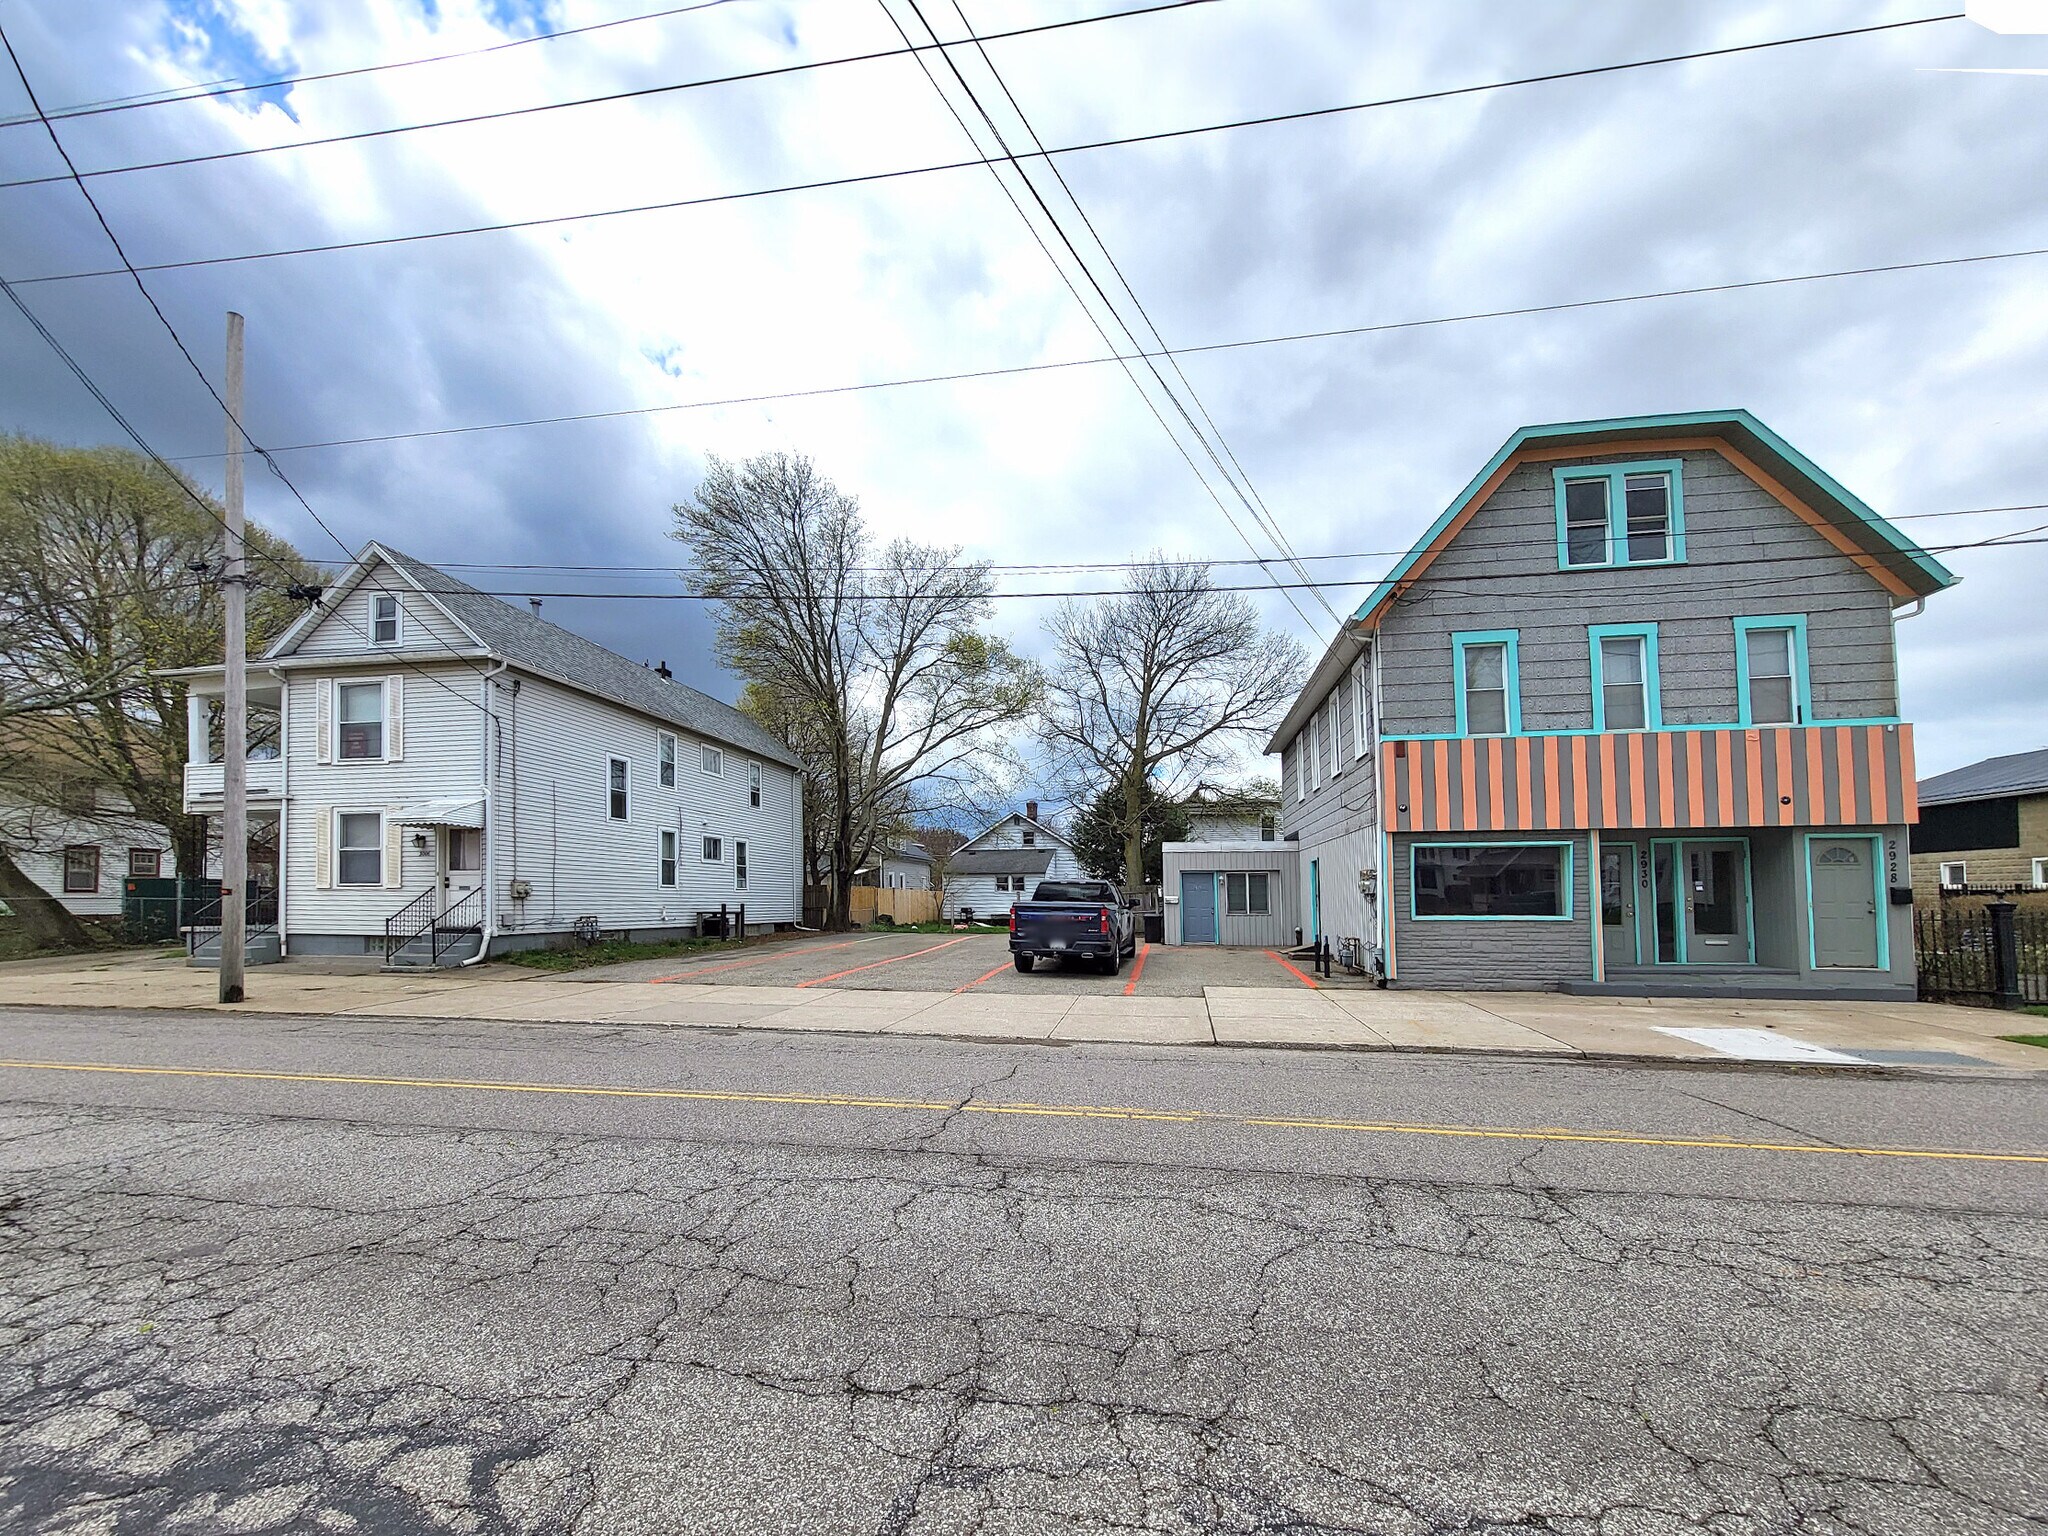
- Comprised Of 3 Contiguous Parcels Totaling 0.19± Acres With Parking For ±14
- $54,615 Annual Income & $42,040 Net Operating Income (2025 Actual)
- $70,053 Pro Forma Annual Income - $57,959 Pro Forma NOI - 9% Pro Forma Cap Rate
Résumé de l'annonce
6-Unit, mixed-use investment package for sale. Comprised of 3 contiguous parcels totaling 0.19± acres with 1 commercial unit & 5 residential rentals. 83% occupancy with excellent income history. $54,615 annual income & $42,040 net operating income (actual - 2025). Upside potential with below market rents. Unit mix includes 911± SF office/storefront, one 1 bedroom/1 bathroom apartment, one 2 bedroom/1 bathroom apartment, one 3 bedroom/1 bathroom single family home & two 3 bedroom/1 bathroom apartments. Off-street parking for ±14 with paved parking lot for ±9 and two private driveways plus on-street parking. All units are separately metered for gas &/or electric (one unit all electric). Centrally located just 0.4 miles (3 blocks) from Erie High School, the City’s only high school, and near Peach Street’s retail/service corridor and multiple public bus routes. Zoned Traditional Single Family Development (R-1A) in the City of Erie’s west side. $70,053 pro forma annual income - $57,959 pro forma NOI. Offered at $645,000 – 9.0% pro forma cap rate. Contact broker for additional details.
Bilan financier (Pro forma - 2026) |
Annuel (CAD) | Annuel par pi² (CAD) |
|---|---|---|
| Revenu de location brut |
104 778 $

|
21,07 $
|
| Autres revenus |
-
|
-
|
| Perte due à l’inoccupation |
5 239 $
|
1,05 $
|
| Revenu brut effectif |
99 539 $
|
20,01 $
|
| Taxes |
10 579 $
|
2,13 $
|
| Dépenses d’exploitation |
6 606 $
|
1,33 $
|
| Total des dépenses |
17 184 $
|
3,45 $
|
| Revenu net d’exploitation |
82 355 $
|
16,56 $
|
Bilan financier (Pro forma - 2026)
| Revenu de location brut (CAD) | |
|---|---|
| Annuel | 104 778 $ |
| Annuel par pi² | 21,07 $ |
| Autres revenus (CAD) | |
|---|---|
| Annuel | - |
| Annuel par pi² | - |
| Perte due à l’inoccupation (CAD) | |
|---|---|
| Annuel | 5 239 $ |
| Annuel par pi² | 1,05 $ |
| Revenu brut effectif (CAD) | |
|---|---|
| Annuel | 99 539 $ |
| Annuel par pi² | 20,01 $ |
| Taxes (CAD) | |
|---|---|
| Annuel | 10 579 $ |
| Annuel par pi² | 2,13 $ |
| Dépenses d’exploitation (CAD) | |
|---|---|
| Annuel | 6 606 $ |
| Annuel par pi² | 1,33 $ |
| Total des dépenses (CAD) | |
|---|---|
| Annuel | 17 184 $ |
| Annuel par pi² | 3,45 $ |
| Revenu net d’exploitation (CAD) | |
|---|---|
| Annuel | 82 355 $ |
| Annuel par pi² | 16,56 $ |
Faits sur la propriété
Unité renseignements sur le mélange
| Description | Nombre d’unités | Loyer moyen/mois | pi² |
|---|---|---|---|
| 1+1 | 1 | - | - |
| 2+1 | 1 | - | - |
| 3+1 | 3 | - | 855 - 1 202 |
1 1
Moyennement accessible à pied
70/100
Moyennement adapté aux voitures
60/100
Transports en commun limités
30/100
Plutôt accessible en vélo
40/100
Impôts fonciers
| Numéro de lot | 19-060-044.0-120.00 | Évaluation totale | 91 202 $ CAD |
| Évaluation du terrain | 16 683 $ CAD | Impôts annuels | 10 579 $ CAD (1,61 $ CAD/pi²) |
| Évaluation des bâtiments | 74 518 $ CAD | Année d’imposition | 2026 Payable 2026 |
Impôts fonciers
Numéro de lot
19-060-044.0-120.00
Évaluation du terrain
16 683 $ CAD
Évaluation des bâtiments
74 518 $ CAD
Évaluation totale
91 202 $ CAD
Impôts annuels
10 579 $ CAD (1,61 $ CAD/pi²)
Année d’imposition
2026 Payable 2026

1 de 30
Vidéos
Visite extérieure 3D Matterport
Visite 3D Matterport
Photos
Vue depuis la rue
Rue
Carte
1 de 1
Présenté par
6-Unit, Mixed-Use Investment Property | 2930 Cherry St
Vous êtes déjà membre? Connectez-vous
Hmm, il semble y avoir eu une erreur lors de l’envoi de votre message. Veuillez réessayer.
Merci! Votre message a été envoyé.