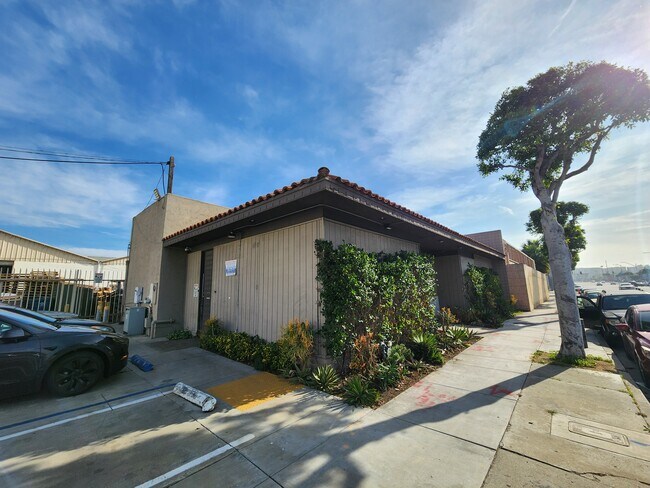
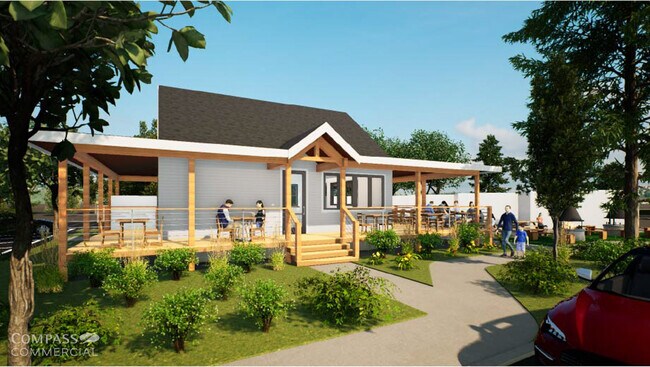
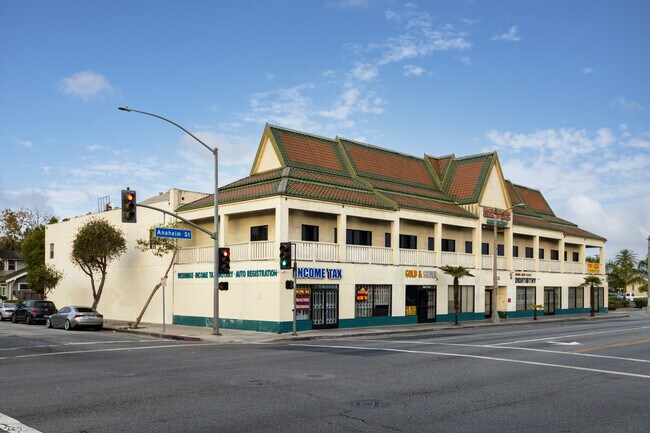
Los Angeles Office/Retail, Flex for Lease - East Hollywood/Silver Lake
Below is a detailed demographic and traffic overview for the area around 2551 Beverly Blvd, Los Angeles, CA (Koreatown / Westlake area) based on typical radius demographic studies used in commercial real estate marketing packages (OMs) and available regional data.
Demographic & Traffic Report
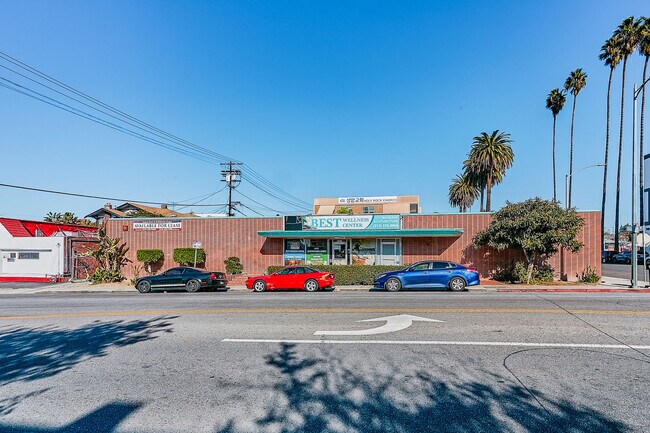
2551 Beverly Blvd, Los Angeles, CA 90057
Location Context
Neighborhood: Westlake / Koreatown
Major corridor: Beverly Blvd
Nearby arterials: Rampart Blvd, Alvarado St, Temple St
Nearby freeway access: US-101 (Hollywood Freeway)
This is a dense urban corridor with heavy multifamily housing and neighborhood retail.
0.5-Mile Radius Demographics
(Approx. 2024 estimates based on census block groups)
Population: ˜ 27,000 – 30,000
Households: ˜ 9,000 – 10,500
Average Household Size:
~3.0 persons
Median Age:
32 – 35
Median Household Income:
$45,000 – $55,000
Average Household Income:
$65,000 – $75,000
Housing Units:
˜ 11,000
Owner Occupied:
~12%
Renter Occupied:
~88%
Population Density:
Very High (urban multifamily)
1-Mile Radius Demographics
Population: ˜ 110,000 – 125,000
Households: ˜ 36,000 – 42,000
Average Household Size:
3.1
Median Age:
33
Median Household Income:
$50,000 – $60,000
Average Household Income:
$72,000 – $85,000
Housing Units:
˜ 45,000
Owner Occupied:
~15%
Renter Occupied:
~85%
Daytime Population:
˜ 130,000+
Major demographic groups:
Hispanic / Latino
Korean
Central American communities
Young renters and workforce households
Consumer Spending (1-mile radius)
Estimated annual retail spending:
Food away from home
$90M+
Groceries
$120M+
Health care / pharmacy
$70M+
Clothing
$60M+
Entertainment / recreation
$50M+
This supports strong demand for:
restaurants
convenience retail
service retail
medical offices
Traffic Counts
Beverly Blvd (near Rampart Blvd)
Average Daily Traffic (ADT)
˜ 25,000 – 32,000 vehicles per day
Rampart Blvd
Average Daily Traffic
˜ 18,000 – 22,000 vehicles per day
Alvarado St
Average Daily Traffic
˜ 28,000 – 35,000 vehicles per day
Traffic counts are measured by LADOT and transportation agencies to support planning and engineering analysis.
Pedestrian Traffic
Very strong pedestrian activity due to:
Dense apartments
Bus corridors
Neighborhood retail
Schools
Hospitals nearby
Foot traffic data in Los Angeles is often aggregated by census block group and used to analyze neighborhood retail demand.
Key Area Drivers
Nearby demand generators:
Koreatown commercial district
MacArthur Park
Downtown LA (10 minutes)
USC
LA Live / Crypto Arena
Multiple hospitals and clinics
Public transit:
Metro B Line (Red Line) nearby
Extensive bus network on Beverly / Alvarado
Retail / Investment Characteristics
This corridor performs well for:
? Restaurants
? Convenience retail
? Grocery / mini-market
? Medical / dental offices
? Service retail
? Small office uses
Because of:
extremely high residential density
strong pedestrian activity
major east-west arterial
Quick Investor Snapshot
0.5-mile population:
~28,000
1-mile population:
~120,000
Traffic count (Beverly Blvd):
~30,000 cars/day
Household density:
Extremely high
Rental market:
85-90% renter population